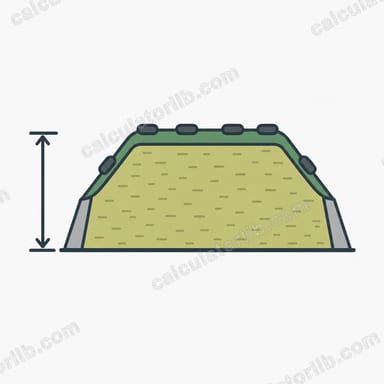
What This Calculator Does
This tool converts the measured dimensions of a silage bunker, trench silo or drive-over pile into a volume and an estimated tonnage. It works in US customary units: dimensions in feet, density in pounds per cubic foot, and tonnage in short tons of 2,000 lb. Knowing how much forage is actually in storage lets you plan feedout rate, check whether inventory will reach the next harvest, and value the pile for a sale or a lease agreement.
How to Use It
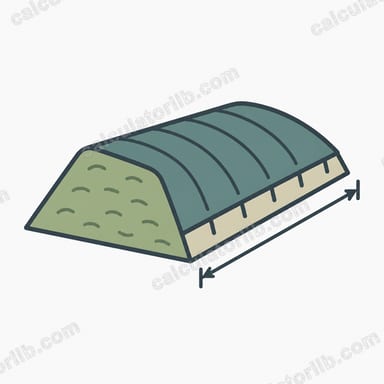
Pick the cross-section that matches your structure. A bunker or trench between walls is rectangular, so enter the inside width and the average settled depth. A free-standing drive-over pile is closest to a triangle: enter the width where the pile meets the pad and the peak height. A pile that was built with a wide flat top is trapezoidal, so enter both the base width and the top width. Always measure after packing and settling, and average several depth readings along the length.
The Formula Explained
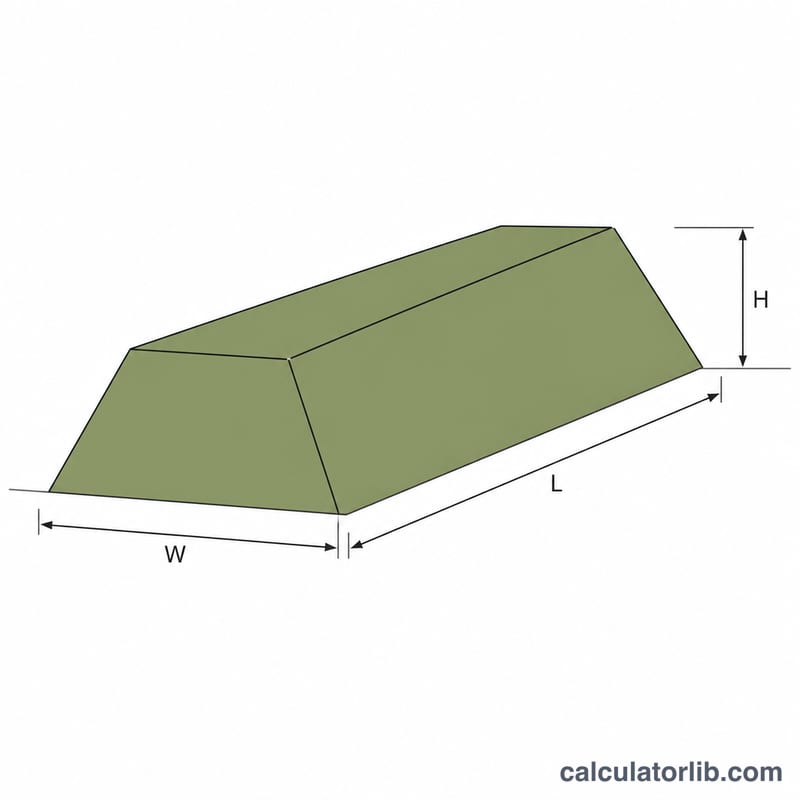
Volume is the cross-sectional area multiplied by the length:
$$V = \frac{W_{b} + W_{t}}{2} \times H \times L$$where \(W_{b}\) = base width in ft, \(W_{t}\) = top width in ft, \(H\) = height or depth in ft, and \(L\) = length in ft. Setting \(W_{t} = W_{b}\) gives the rectangular bunker case and \(W_{t} = 0\) gives the triangular pile case. Tonnage then follows from density \(\rho\):
$$T_{af} = \frac{V \times \rho}{2000}, \qquad T_{dm} = T_{af} \times \frac{DM}{100}$$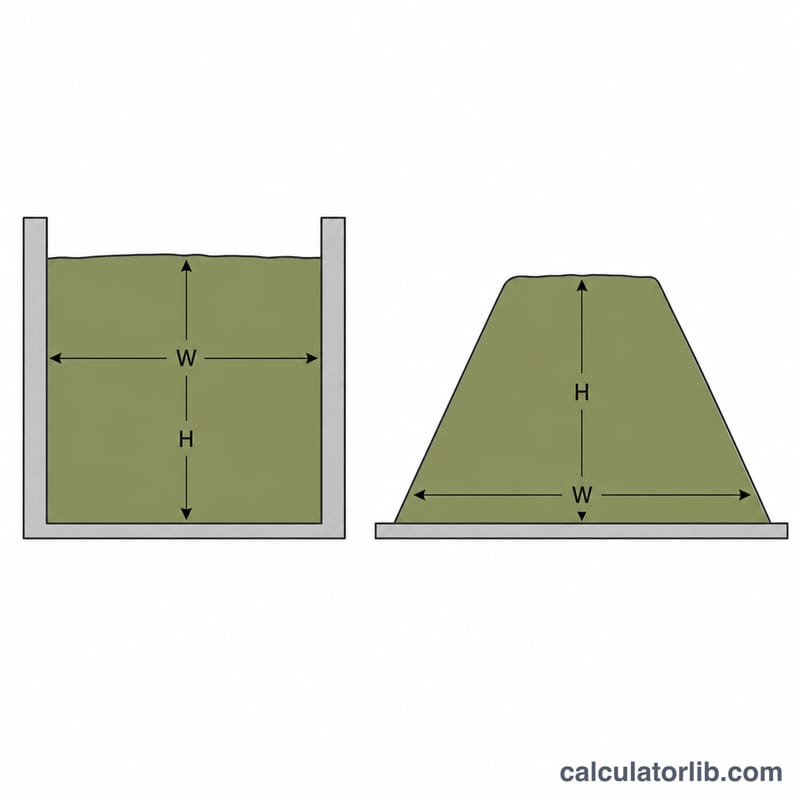
Worked Example
A bunker measures 100 ft long, 40 ft wide inside, with an average settled depth of 8 ft. Corn silage at 44 lb per cubic foot as-fed and 35% dry matter:
$$V = 40 \times 8 \times 100 = 32{,}000\,\text{cu ft}$$$$T_{af} = \frac{32{,}000 \times 44}{2000} = 704\,\text{tons}$$$$T_{dm} = 704 \times 0.35 = 246.4\,\text{tons DM}$$That is about 1,185 cubic yards, or roughly 14 weeks of feed for a herd eating 5 tons as-fed per day.
Silage Density and Dry Matter Reference Values
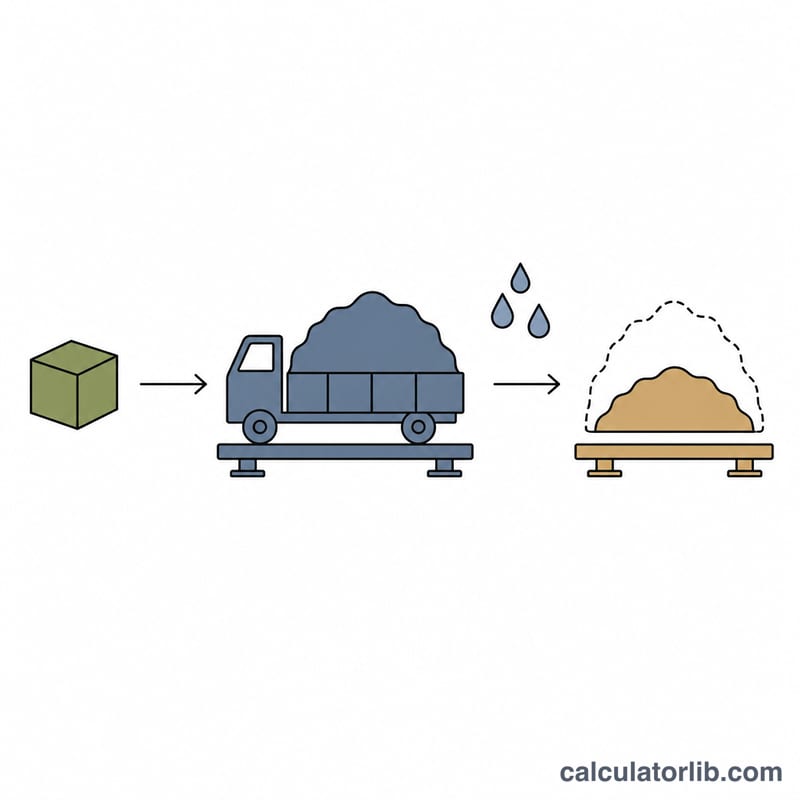
The density figure you enter drives the tonnage output, so it is worth choosing carefully. The ranges below are drawn from published North American forage-density survey work and extension guidance (for example the University of Wisconsin and Penn State bunker-density surveys, which report results in pounds per cubic foot). They are typical ranges, not guarantees: two piles of the same crop can differ by 30% or more in density depending on how they were filled. Note that these are US customary units (lb/ft³); 1 lb/ft³ ≈ 16.02 kg/m³.
| Stored forage / storage type | Typical as-fed density (lb/ft³) | Typical dry matter (%) | Resulting lb DM/ft³ |
|---|---|---|---|
| Corn silage, well-packed walled bunker | 40–48 | 32–38 | ~14–16 |
| Corn silage, free-standing drive-over pile | 32–42 | 30–38 | ~11–14 |
| Haylage / alfalfa or grass silage, bunker | 35–45 | 35–50 | ~13–20 |
| Small-grain (cereal) silage — wheat, rye, triticale, oat | 32–42 | 30–40 | ~10–15 |
| High-moisture corn (bunker or bag) | 48–55 | 70–75 | ~34–41 |
| Earlage / snaplage | 40–50 | 55–65 | ~24–31 |
How to read the DM column: it is simply the as-fed density multiplied by the dry matter fraction. For corn silage at 44 lb/ft³ and 35% DM:
$$44 \ \text{lb/ft}^3 \times \frac{35}{100} = 15.4 \ \text{lb DM/ft}^3$$
What moves density up or down
- Packing tractor weight and packing time. A common extension rule of thumb is roughly 800 lb of packing tractor weight for every ton of crop delivered per hour; under-packing is the single most frequent cause of low density.
- Layer thickness. Spreading in thin layers — about 6 inches or less before each packing pass — lets the weight reach the material. Thick lifts trap air.
- Delivery rate. When trucks arrive faster than the packing tractor can work the pile, density falls even with adequate weight on site.
- Dry matter at harvest. Very dry crop (above roughly 40% DM) resists packing; very wet crop packs easily but adds water weight, raising as-fed density while lb DM/ft³ may still be modest.
- Walls versus no walls. Walled bunkers pack denser than free-standing drive-over piles because the crop is confined and the tractor can work close to a vertical face. Pile sides also slope, so the average depth over the footprint is less than the peak height — use the trapezoid or triangle shape option rather than the peak height with a rectangular assumption.
- Depth in the pile. Material near the floor is compressed by everything above it and is denser than material near the top surface.
Only site-specific measurement is accurate. Core samples taken with a forage probe at several heights and positions, or a set of scale-weighed loads recorded against measured filled volume, are the only reliable way to know your own density. Table values are a starting estimate for planning — not a basis for a sale contract.
Using the Result for Feedout and Inventory Planning
The as-fed and dry matter tonnages this calculator returns are most useful when you turn them into days of feed and compare that with your next harvest date. Work through the steps below in order.
-
Convert herd demand into tons per day. Multiply head fed by pounds of this silage per head per day (as-fed, not DM) and divide by 2,000:
$$\text{tons/day} = \frac{\text{head} \times \text{lb as-fed per head per day}}{2000}$$
For 250 head eating 55 lb of corn silage each per day: \( (250 \times 55) \div 2000 = 6.875 \) tons/day.
-
Divide inventory by daily demand to get days of feed. Take a 250 ft × 40 ft bunker filled to an average 12 ft depth at 44 lb/ft³ and 35% DM. Volume is \(40 \times 12 \times 250 = 120{,}000\) ft³, which is 2,640 as-fed tons (924 DM tons). At 6.875 tons/day that is about 384 days of feed gross — before shrink.
-
Deduct a realistic shrink allowance before you commit the inventory. Storage and feedout losses of 10–20% of as-fed tonnage are commonly cited for well-managed bunkers and covered piles, and losses run higher for uncovered or poorly sealed free-standing piles. Continuing the example at 15% shrink: \(2{,}640 \times 0.85 = 2{,}244\) usable as-fed tons, or roughly 326 days of feed. That is the number to compare against your next harvest — if harvest is 365 days out, you are short and should plan a purchase now rather than discover it in August.
-
Check that the geometry allows a fast enough feedout face. Aim to remove at least 6 inches of face depth per day, and closer to 12 inches per day in warm weather, to stay ahead of spoilage. Estimate what your herd actually removes: daily tons divided by (face area × density). In the example, 6.875 tons = 13,750 lb; at 44 lb/ft³ that is 312 ft³, and across a 40 ft × 12 ft face (480 ft²) it is only about 0.65 ft — roughly 7.8 inches per day. Acceptable in cool weather, marginal in summer. If your calculated removal is under 6 in/day, the structure is too wide or too tall for the herd: consider narrowing the fill, splitting into two smaller piles, or feeding a second group from the same face.
- Remeasure after settling. Piles and bunkers lose noticeable height in the first weeks after covering. Measure again once settling has stopped, and take several depth readings across the width and along the length and average them rather than using the peak. For a sloped drive-over pile, use the trapezoid or triangle shape option with an honest base and top width — treating a sloped pile as a rectangular box is the most common way inventory gets overstated.
- Round down, and verify before money changes hands. For budgeting, purchasing decisions and ration planning, round the usable tonnage downward: an optimistic inventory is discovered as a feed shortage at the worst time of year. Before a sale, a custom-feeding agreement or a lease or estate valuation, back the estimate up with scale tickets on weighed loads and laboratory DM on core samples. Dimensional estimates carry real uncertainty in both depth and density, and buyers, sellers and lenders should be working from weighed and sampled numbers, not geometry.
Two practical notes. First, price and trade silage on a dry matter basis wherever possible — as-fed tons of 30% DM and 38% DM crop are not the same feed, and DM tons is the column that compares fairly. Second, keep a simple running log: measured volume at covering, density basis used, shrink assumption, and actual feedout tons by month. After one season that log tells you your own density and shrink figures, which beats any published table.
This is general agricultural and inventory guidance, not professional agronomic, nutritional or financial advice. Feeding rates, shrink allowances and valuation methods vary by crop, climate, storage structure and local practice — consult your nutritionist, extension specialist or adviser for decisions specific to your operation.
Frequently Asked Questions
What density should I use?
Well-packed corn silage in a bunker typically runs 40-48 lb per cubic foot as-fed, which is about 14-16 lb of dry matter per cubic foot. Haylage and loose drive-over piles are often lower. If you have core-sample data from your own site, use it.
Why does my measured tonnage differ from scale tickets?
Shrink from fermentation, respiration and spoilage commonly removes 10-20% of what went in, and surface waste is rarely uniform. Treat the result as standing inventory, not as harvested yield.
Should I measure before or after packing?
After. A freshly dumped pile has far more air, so measuring it fresh with a packed-silage density figure will badly overstate the tonnage.