What this calculator does
This tool estimates how much electricity a wind turbine produces over a chosen period from four physical inputs: average wind speed, rotor swept area, air density and overall efficiency (the power coefficient). It is a universal physics calculator, so it applies anywhere in the world with no country-specific rules. Use it for feasibility sketches, school projects, or to compare rotor sizes and sites.
How to use it
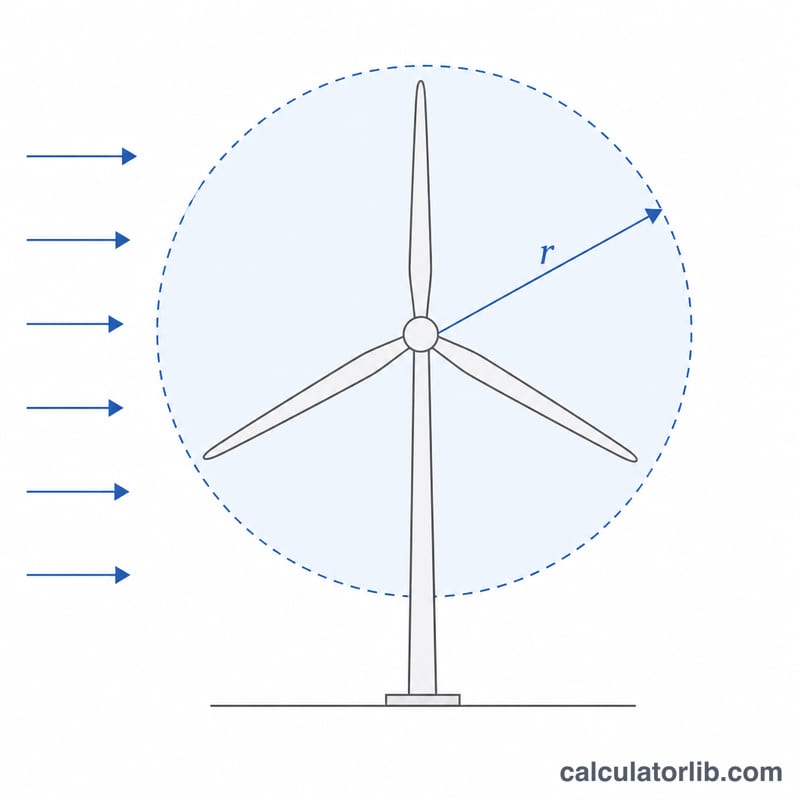
Enter the long-term average wind speed at hub height in metres per second, the rotor swept area in square metres (for a rotor of diameter \(d\), \(A = \tfrac{\pi d^2}{4}\)), your efficiency figure, and the air density (1.225 kg/m³ is standard sea-level air; thinner at altitude or in hot weather). Then set the period in days. The result shows average power in kilowatts plus total energy in kWh and MWh.
The formula explained
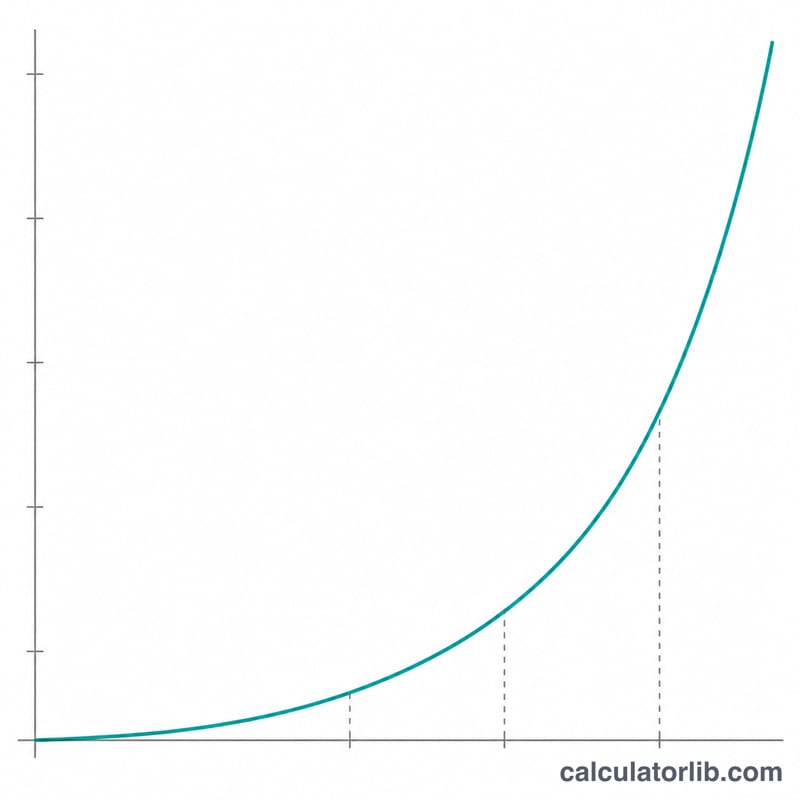
Wind power follows a cubic law:
$$P = \frac{1}{2} \rho A v^3 C_p$$where \(\rho\) = air density in kg/m³, \(A\) = swept area in m², \(v\) = wind speed in m/s and \(C_p\) = efficiency as a decimal. Energy is power × time:
$$E_{kWh} = \frac{P \times t}{1000}$$Because of the \(v^3\) term, a site with 20% more wind yields about 73% more energy — site selection matters far more than rotor tweaks.
Worked example
A turbine with \(A = 5000\,\text{m}^2\), \(v = 12\,\text{m/s}\), \(\rho = 1.225\), \(C_p = 0.40\), over 365 days:
$$P = 0.5 \times 1.225 \times 5000 \times 12^3 \times 0.40 = 2{,}116{,}800\,\text{W}$$ $$E = \frac{2{,}116{,}800 \times 8760}{1000} = 18{,}543{,}168\,\text{kWh}$$That is about 18,543 MWh, or roughly 2,117 kW of average output.
Interpreting Your Result
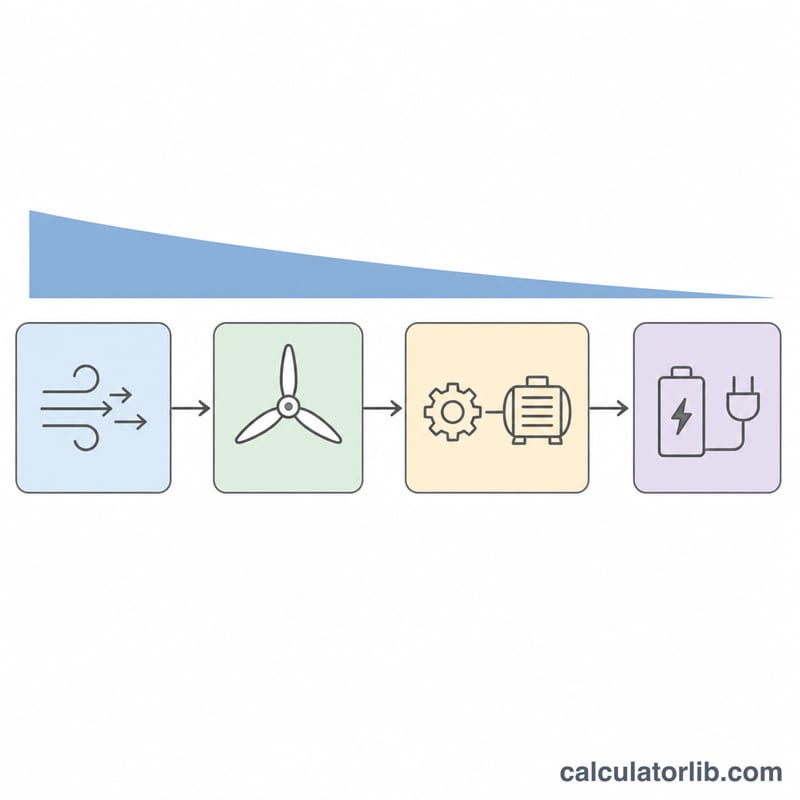
The kWh value this calculator returns is the energy available in a steady wind blowing at exactly the speed you entered, for the whole period, with the efficiency you entered applied uniformly. It is an energy-in-the-wind calculation, not a production forecast for a real turbine at a real site.
Capacity factor: the reality check
The standard way to compare a real machine's output with its nameplate is the capacity factor:
$$\text{CF} = \frac{E_{\text{annual}}\ (\text{kWh})}{P_{\text{rated}}\ (\text{kW}) \times 8760}$$
Published typical bands for modern fleets are roughly 25–40% onshore and 40–55% offshore. These are broad international ranges — individual projects fall outside them in both directions, and national averages differ markedly by wind resource, turbine specific power and grid curtailment, so check your own country's published statistics before using a number for planning.
Why one mean speed is the wrong input for a real site
Two opposing errors are at work, and they do not cancel:
- The cube of the mean understates the mean of the cube. Real wind speeds are usually described by a Weibull distribution (the Rayleigh distribution, Weibull shape \(k = 2\), is the common default). For a Rayleigh wind, the mean of \(v^{3}\) is about 1.91 times \(\bar{v}^{3}\) — so the available energy in variable wind exceeds what the mean speed alone suggests. This factor is often called the energy pattern factor.
- Turbine limits claw that back and more. A turbine produces nothing below cut-in (typically ~3–4 m/s), is capped at rated power above rated speed (so the high-wind hours that carry most of the energy are deliberately not fully harvested), and shuts down above cut-out (typically ~25 m/s, with some designs using a gradual storm-mode ramp-down instead). Once capping and cut-out are applied, feeding a single mean speed into \(v^{3}\) usually overstates deliverable annual output.
Proper energy yield assessment convolves the site's measured speed distribution with the turbine's certified power curve hour by hour — the approach standardised in the IEC 61400 series (IEC 61400-12 covers power performance measurement) — rather than cubing an average.
Losses to subtract
- Availability: a few percent for scheduled maintenance, faults and grid outages.
- Array / wake losses: turbines downstream of others see slowed, more turbulent air; wind-farm wake losses commonly run from a few percent in sparse layouts to well over 10% in dense ones.
- Electrical, blade-degradation, icing and curtailment losses: each typically small individually, but cumulative.
Use hub-height wind speed, not measurement-height
Wind speed increases with height, so a speed measured at a 10 m mast or taken from a weather station is not the speed at the hub. A common first approximation is the power law:
$$v_2 = v_1\left(\frac{h_2}{h_1}\right)^{\alpha}$$
with shear exponent \(\alpha \approx 0.14\) (the "one-seventh power law") over open, flat terrain; \(\alpha\) is lower over water and smooth surfaces and considerably higher over forest, suburbs or complex terrain. For example, 6.0 m/s measured at 10 m extrapolates to \(6.0 \times (80/10)^{0.14} \approx 8.0\) m/s at an 80 m hub — and because of the cube law that is about 2.4 times the power. Extrapolate to hub height before entering a speed here, or the result will be meaningless for the real machine.
Practical reading of your number
Treat the output as an upper bound and a sensitivity tool: use it to see how much a taller tower, a larger rotor, a denser-air site or a windier location changes the physics. For an investment or sizing decision, follow it with a power-curve-based yield estimate using site-measured wind data and a specific turbine model.
FAQ
Why cannot efficiency exceed 59.3%? The Betz limit proves no rotor can extract more than \(\tfrac{16}{27} \approx 59.3\%\) of the kinetic energy in the wind. Modern large turbines reach 35–45% after drivetrain and generator losses.
Will a real turbine match this number? Usually not. Using one average speed ignores the wind distribution, cut-in and cut-out speeds, rated-power capping and maintenance downtime. Treat the result as a theoretical ceiling and apply a capacity-factor or availability haircut.
How do I convert rotor diameter to swept area? Use \(A = \tfrac{\pi d^2}{4}\); a 80 m rotor gives about 5027 m².