
What is the Tax Bracket Calculator?
This calculator estimates your 2026 US federal income tax using the official progressive tax brackets for Single and Married Filing Jointly filers. It applies each marginal rate only to the income that falls within that bracket, then reports your total tax, marginal rate, effective rate, and after-tax income. It does not account for state taxes, deductions beyond what you enter as taxable income, or credits.
How to use it
Enter your taxable income (income after deductions) and choose your filing status. The result shows the estimated federal tax owed, the marginal rate (the rate on your last dollar), the effective rate (average rate across all income), and what's left after tax.
The formula explained
The US uses a progressive system: only the portion of income inside each bracket is taxed at that bracket's rate. For each bracket with lower bound \(l\), upper bound \(u\), and rate \(r\), the tax is \((\min(\text{income}, u) - l) \times r\), summed over all brackets the income reaches.
$$\text{Tax} = \sum_{i} \big(\min(I, u_i) - l_i\big)^{+} \cdot r_i$$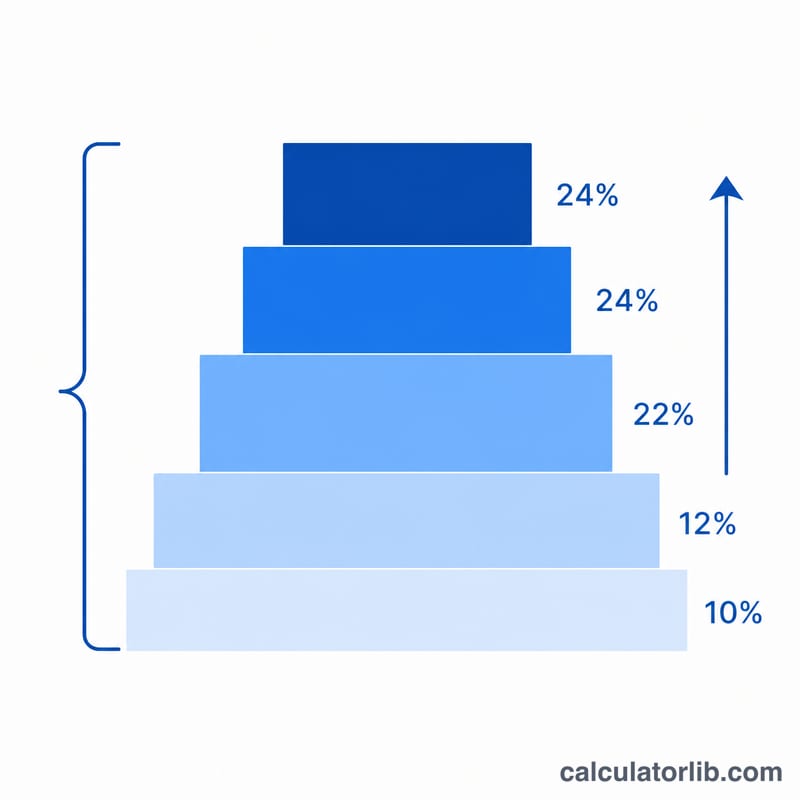
Worked example
For a Married Filing Jointly return with $100,000 taxable income (2026): the first $24,800 is taxed at 10% = $2,480; the remaining $75,200 falls entirely within the 12% band (which for 2026 runs up to $100,800) and is taxed at 12% = $9,024. There is no 22% portion because the 12% ceiling rose to $100,800. Total =
$$\$2{,}480 + \$9{,}024 = \mathbf{\$11{,}504}$$The effective rate is
$$\frac{11{,}504}{100{,}000} = 11.504\%,$$leaving $88,496 after tax.
2026 Federal Tax Brackets by Filing Status
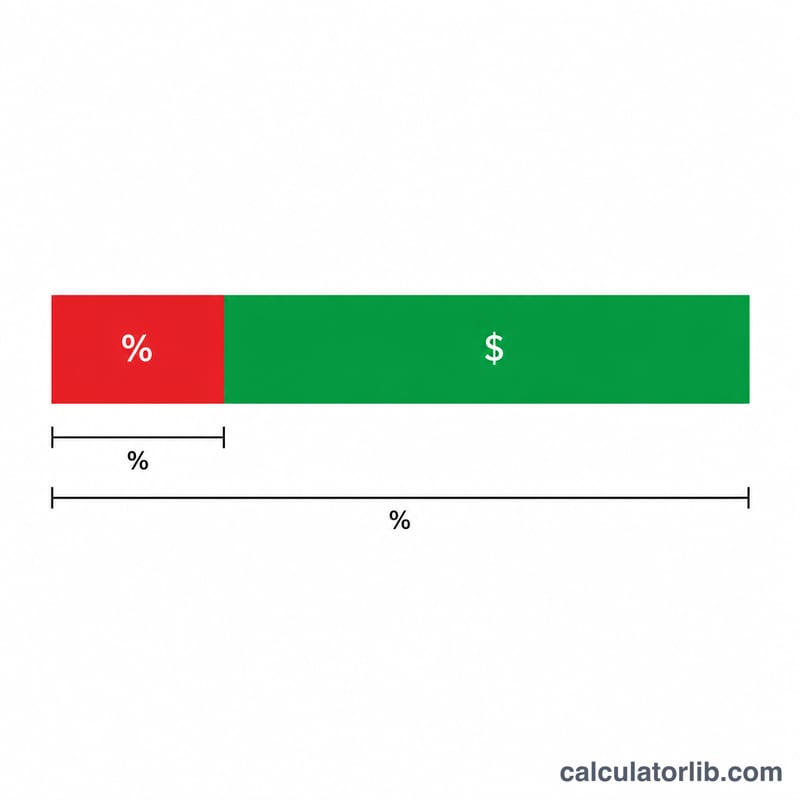
These are the US federal income tax brackets for tax year 2026 (income earned in 2026, reported on returns filed in 2027), based on the IRS annual inflation adjustments for tax year 2026. They apply to taxable income (income after deductions) and do not include state or local income taxes, payroll taxes (Social Security and Medicare), or other federal taxes. Each rate applies only to the slice of income inside its bracket.
Single filers
| Rate | Taxable income from | Taxable income up to |
|---|---|---|
| 10% | $0 | $12,400 |
| 12% | $12,400 | $50,400 |
| 22% | $50,400 | $105,700 |
| 24% | $105,700 | $201,775 |
| 32% | $201,775 | $256,225 |
| 35% | $256,225 | $640,600 |
| 37% | $640,600 | No limit |
Married filing jointly
| Rate | Taxable income from | Taxable income up to |
|---|---|---|
| 10% | $0 | $24,800 |
| 12% | $24,800 | $100,800 |
| 22% | $100,800 | $211,400 |
| 24% | $211,400 | $403,550 |
| 32% | $403,550 | $512,450 |
| 35% | $512,450 | $768,700 |
| 37% | $768,700 | No limit |
Source: IRS inflation adjustments for tax year 2026. Other filing statuses (head of household, married filing separately) use different thresholds that are not shown here.
2027 Federal Tax Brackets (Tax Year 2027)
Choose Tax year 2027 in the calculator to use these figures. They are the IRS inflation adjustments for tax year 2027 (Rev. Proc. 2026-35) and apply to income earned in 2027, reported on returns filed in 2028. Tax year 2026 stays the default for returns filed in 2027.
Single filers
| Rate | Taxable income from | Taxable income up to |
|---|---|---|
| 10% | $0 | $12,800 |
| 12% | $12,800 | $52,025 |
| 22% | $52,025 | $109,125 |
| 24% | $109,125 | $208,325 |
| 32% | $208,325 | $264,550 |
| 35% | $264,550 | $661,375 |
| 37% | $661,375 | No limit |
Married filing jointly
| Rate | Taxable income from | Taxable income up to |
|---|---|---|
| 10% | $0 | $25,600 |
| 12% | $25,600 | $104,050 |
| 22% | $104,050 | $218,250 |
| 24% | $218,250 | $416,650 |
| 32% | $416,650 | $529,100 |
| 35% | $529,100 | $793,650 |
| 37% | $793,650 | No limit |
Tax Comparison Across Income Levels and Filing Statuses
Each figure below is computed from the 2026 federal brackets above, applied to taxable income. After-tax income is taxable income minus federal income tax (it ignores deductions already taken, credits, state taxes and payroll taxes).
| Filing status | Taxable income | Total tax | Marginal rate | Effective rate | After-tax income |
|---|---|---|---|---|---|
| Single | $40,000 | $4,552 | 12% | 11.38% | $35,448 |
| Married filing jointly | $40,000 | $4,304 | 12% | 10.76% | $35,696 |
| Single | $75,000 | $11,212 | 22% | 14.95% | $63,788 |
| Married filing jointly | $75,000 | $8,504 | 12% | 11.34% | $66,496 |
| Single | $100,000 | $16,712 | 22% | 16.71% | $83,288 |
| Married filing jointly | $100,000 | $11,504 | 12% | 11.50% | $88,496 |
| Single | $150,000 | $28,598 | 24% | 19.07% | $121,402 |
| Married filing jointly | $150,000 | $22,424 | 22% | 14.95% | $127,576 |
| Single | $250,000 | $56,456 | 32% | 22.58% | $193,544 |
| Married filing jointly | $250,000 | $45,196 | 24% | 18.08% | $204,804 |
Example (single, $75,000): $12,400 × 10% + ($50,400 − $12,400) × 12% + ($75,000 − $50,400) × 22% = $1,240 + $4,560 + $5,412 = $11,212.
Note: the effective rate is always below the marginal rate, because lower brackets are taxed at lower rates and only the top slice of income is taxed at the marginal rate.
FAQ
What's the difference between marginal and effective rate? Your marginal rate is the rate applied to your highest dollar of income; your effective rate is your total tax as a percentage of all income, which is always lower.
Is this based on gross or taxable income? Enter taxable income — your gross income minus the standard or itemized deductions.
Does this include state taxes? No, this is federal income tax only and excludes state tax, FICA, credits, and the alternative minimum tax.