
What Is the Tipped Wage Calculator?
Many service-industry workers — servers, bartenders, baristas, delivery drivers — earn a low base hourly wage that is supplemented by tips. This calculator combines your base wage, hours worked, and total tips into a single number: your effective hourly wage. That figure tells you what you actually earn for every hour on the clock, which is far more useful than looking at your base rate alone.
How to Use It
Enter three values: your base hourly wage (for example, the U.S. federal tipped minimum of $2.13 in some states), the number of hours you worked in the period, and the total tips you collected over those hours. The calculator returns your effective hourly wage along with your base pay, tips per hour, and total earnings.
The Formula Explained
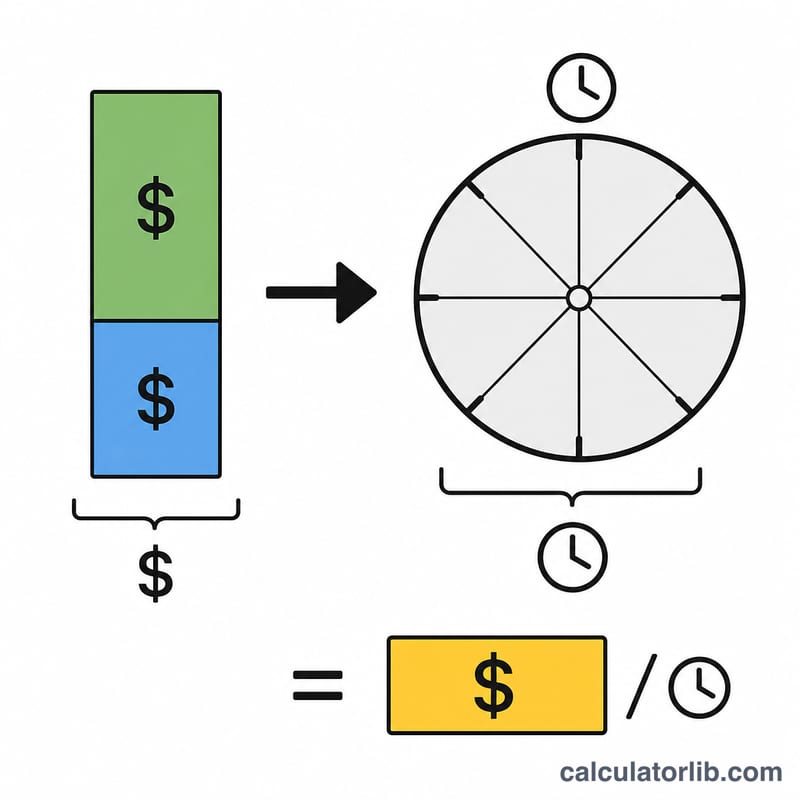
The math is straightforward. First, your base pay is your wage multiplied by hours: base wage \(\times\) hours. Add your total tips to get total earnings. Divide total earnings by hours worked to find the effective hourly rate:
$$\text{Effective Hourly} = \frac{\left(\text{Base Wage} \times \text{Hours}\right) + \text{Total Tips}}{\text{Hours}}$$
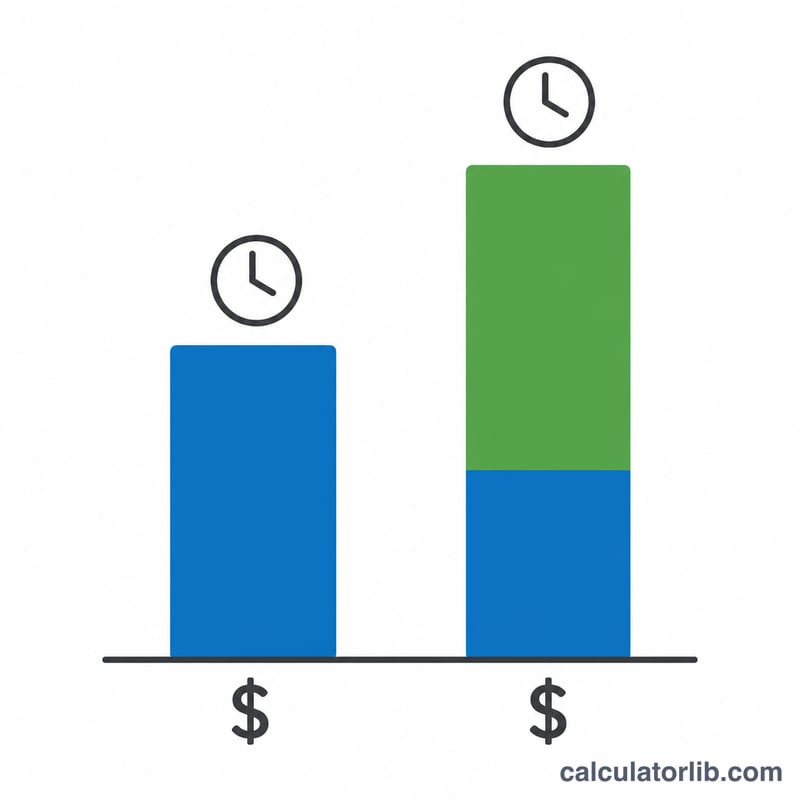
This is mathematically the same as base wage + (total tips \(\div\) hours), so your effective wage is simply your base rate plus your average tips per hour.
Worked Example
Suppose you earn a base wage of $2.13/hour, work 40 hours, and collect $320 in tips. Base pay is \(2.13 \times 40 = \$85.20\). Total earnings are \(85.20 + 320 = \$405.20\). Divide by 40 hours and your effective hourly wage is $10.13. Your tips alone add $8.00 per hour on top of the base rate.
U.S. Minimum Wage and Tip Credit Reference
The figures below are U.S. federal values under the Fair Labor Standards Act (FLSA). They do not apply outside the United States, and many U.S. states set different rules.
| Item | Federal amount |
|---|---|
| Federal minimum wage | $7.25 per hour |
| Federal minimum cash wage for tipped employees | $2.13 per hour |
| Maximum federal tip credit | $5.12 per hour (\(7.25 - 2.13 = 5.12\)) |
| Tipped-employee threshold | Employee customarily and regularly receives more than $30 per month in tips |
- The $30/month threshold determines whether a worker counts as a "tipped employee" for the tip credit.
- States set their own tipped minimums. Some require the full state minimum wage with no tip credit, and others set a cash wage higher than $2.13. Where state and federal rules differ, the rule more favorable to the employee generally applies.
- These figures can change. Check the current U.S. Department of Labor website and your state labor agency for up-to-date amounts.
Effective Hourly Wage Across Sample Scenarios
The calculator uses \(\text{Effective} = \text{Base} + \frac{\text{Tips}}{\text{Hours}}\). This is the same as dividing total earnings (base pay plus tips) by hours worked. The scenarios are illustrative, not typical or average figures.
| Scenario | Base wage | Hours | Base pay | Total tips | Tips per hour | Total earnings | Effective hourly |
|---|---|---|---|---|---|---|---|
| Moderate-high tips | $2.13 | 30 | $63.90 | $450.00 | $15.00 | $513.90 | $17.13 |
| Low tips | $2.13 | 25 | $53.25 | $100.00 | $4.00 | $153.25 | $6.13 |
| Moderate tips | $5.00 | 40 | $200.00 | $320.00 | $8.00 | $520.00 | $13.00 |
| Moderate tips | $7.25 | 20 | $145.00 | $180.00 | $9.00 | $325.00 | $16.25 |
| Full-minimum-wage state (hypothetical $15.00 base) | $15.00 | 35 | $525.00 | $210.00 | $6.00 | $735.00 | $21.00 |
Example of the arithmetic for the first row: \(2.13 + \frac{450}{30} = 2.13 + 15.00 = 17.13\). For the second row: \(2.13 + \frac{100}{25} = 2.13 + 4.00 = 6.13\).
The $15.00 base in the last row is a hypothetical figure for a place that requires full minimum wage for tipped workers. It is not the rate of any particular state.
Interpreting Your Effective Hourly Wage
- It is gross and pre-tax. The result shows earnings before income tax, payroll tax and any tip-outs or tip pooling deductions you did not enter. Tip reporting and taxes are not included in the calculation.
- It depends on the period measured. A single shift, a week and a month can give quite different results. Use the same hours and tips for the same period, and include all hours worked.
- Compare it to $7.25. Under the U.S. federal FLSA, if the cash wage plus the tip credit does not reach $7.25 per hour, the employer must pay the difference. In the low-tips scenario above, tips were $4.00 per hour against a maximum tip credit of $5.12, so the employer would owe about \(5.12 - 4.00 = 1.12\) per hour, or \(1.12 \times 25 = 28.00\) over 25 hours, under the federal rule. Your state may require more.
- Results vary. Shift, day of the week, season, venue type, location and service volume all change tips, so one result is not a forecast.
- Check your records. Reconcile the tips you enter with your reported tips and pay stubs. Your effective wage is only as accurate as those inputs.
This is general information, not legal, tax or financial advice. For questions about your own pay, consult the U.S. Department of Labor, your state labor agency or a qualified professional.
Income and jobs: United States
Average income and unemployment in United States compared with the world, from the World Bank: a benchmark for the figures you enter above.
- GNI per capita 2025
- 88,810 USD
- GDP per capita, PPP 2025
- 90,027 intl. $
- World: 25,704
- Unemployment 2025
- 4.2%
- World: 4.8%
Latest change Up +7.1% 2025: 88,810 USD, against 82,910 USD in 2024. CalculatorLib computes this change from the two published figures.
In 2025, gross national income per person in United States was 88,810 US dollars a year, about 7,401 US dollars a month. World: 14,244 USD
| Year | GNI per capita (USD) | GDP per capita, PPP (intl. $) | Unemployment |
|---|---|---|---|
| 2025 | 88,810 | 90,027 | 4.2% |
| 2024 | 82,910 | 86,170 | 4.0% |
| 2023 | 79,950 | 82,587 | 3.6% |
| 2022 | 77,230 | 78,009 | 3.7% |
| 2021 | 71,510 | 71,441 | 5.3% |
| 2020 | 64,630 | 64,465 | 8.1% |
| 2019 | 65,840 | 65,228 | 3.7% |
| 2018 | 63,040 | 62,876 | 3.9% |
| 2017 | 58,860 | 60,048 | 4.4% |
| 2016 | 56,830 | 57,977 | 4.9% |
GNI per capita (Atlas method) is the average of all income in the economy, not a typical salary; PPP dollars adjust for local prices.
Income tax and social security: United States
- Top income tax rate 2025
- 43.65%
- from 8.7 × the average wage
- Employee social security 2025
- 7.65% · 1.45%
In 2025, the top statutory personal income tax rate in United States (central and local government combined) was 43.65%. It applies from 8.7 times the average wage of 73,520 USD, that is from about 642,101 USD a year.
Employee social security contribution rates for successive earnings bands, lowest band first; the band limits are not shown.
Top income tax rates in OECD countries
| Country | Top rate | Applies from (× average wage) | Year |
|---|---|---|---|
| Japan | 55.95% | 7.7 | 2025 |
| France | 55.37% | 12.9 | 2025 |
| South Korea | 49.5% | 19.0 | 2025 |
| Germany | 47.48% | 4.4 | 2025 |
| United Kingdom | 45% | 2.2 | 2025 |
| United States | 43.65% | 8.7 | 2025 |
| Türkiye | 40.76% | 5.6 | 2025 |
| Mexico | 35% | 20.6 | 2025 |
The top rate is the statutory rate on the highest earnings, not the rate most workers pay. OECD figures cover OECD member countries only.
United States and other countries
GNI per capita in current US dollars (Atlas method) — each country’s latest published year.
- United States 88,810 USD (2025)
- France 48,630 USD (2025)
- Japan 38,340 USD (2025)
- South Korea 37,880 USD (2025)
- Saudi Arabia 36,070 USD (2025)
- Türkiye 16,300 USD (2025)
- Russia 15,960 USD (2025)
- World 14,244 USD (2025)
- China 14,230 USD (2025)
- Mexico 13,730 USD (2025)
- Vietnam 4,970 USD (2025)
- India 2,760 USD (2025)
No published figure yet for Taiwan.
Years can differ between rows: each figure is shown with its own year. The same World Bank indicator for every country.
Latest figure: 2025 Data last updated 2026-10-18 · current
Source: The World Bank Group CC BY 4.0; OECD, Tax Database CC BY 4.0
Monthly figures are computed by CalculatorLib from these data. The top-rate threshold in national currency (multiple × average wage) is computed by CalculatorLib from these data.
Source details and methodology
- The World Bank Group — World Development Indicators (NY.GNP.PCAP.CD, NY.GDP.PCAP.PP.CD, SL.UEM.TOTL.ZS)
- OECD, Tax Database — Top statutory personal income tax rate; employee social security contribution rates
FAQ
Does this account for taxes? No — this shows gross effective earnings before income, payroll, or tip-reporting taxes.
What if my effective wage is below minimum wage? In the U.S., employers must make up the difference (the "tip credit" rule) so tipped employees reach the full minimum wage. Use this tool to check whether your tips bridge that gap.
Can I use it for a single shift or a whole week? Yes. Just make sure the hours and total tips cover the same period.