What the truss span calculator does
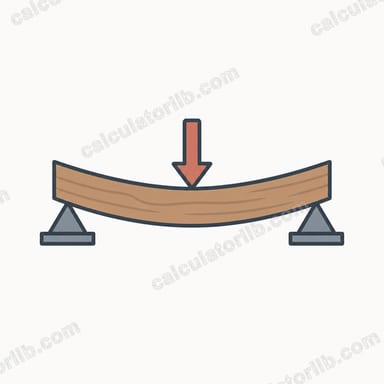
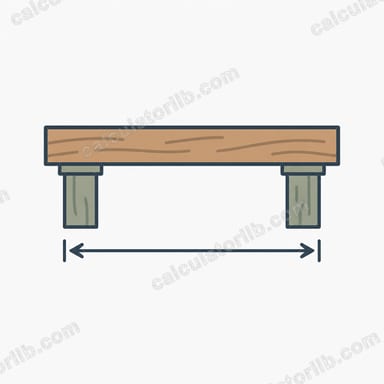
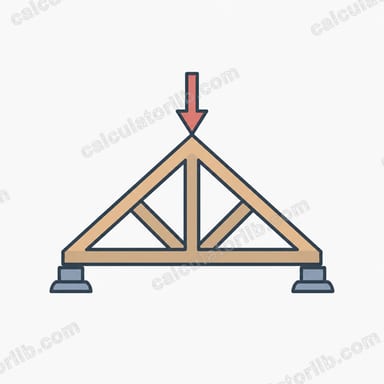
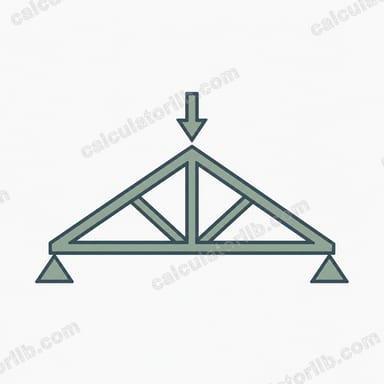
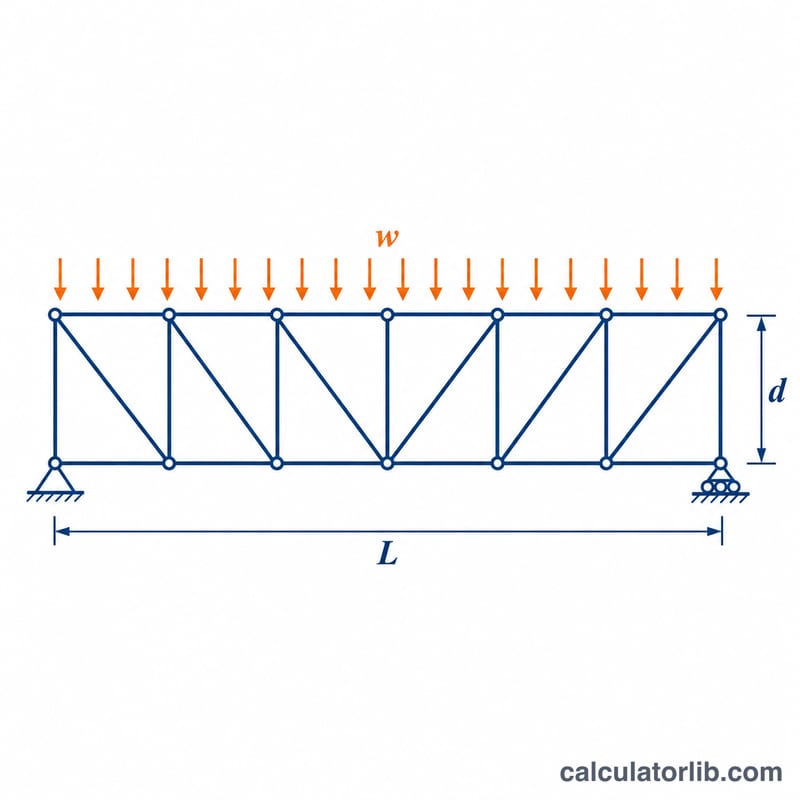
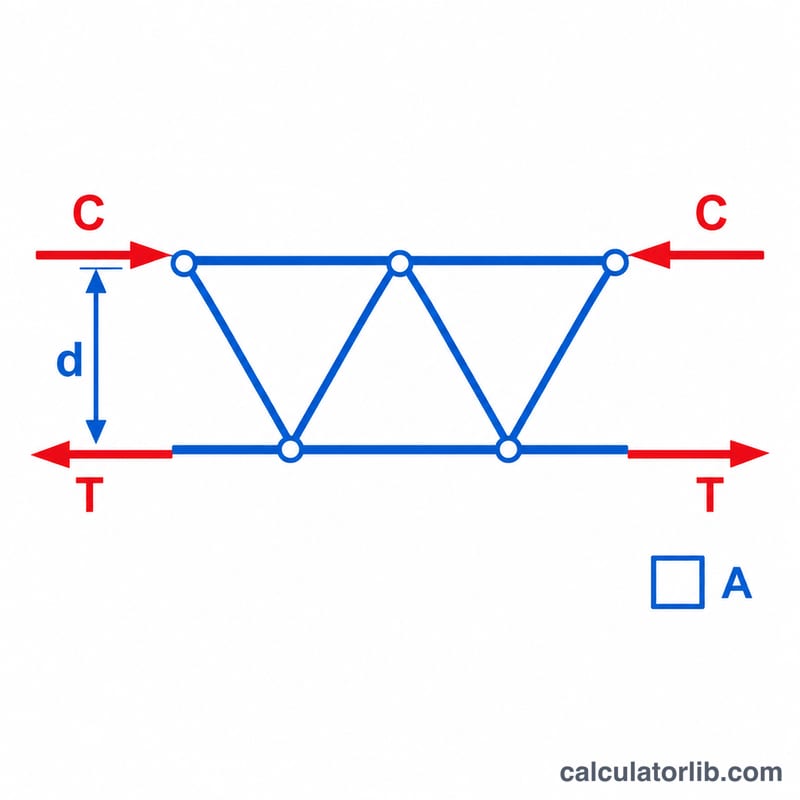
This calculator gives a preliminary estimate of how far a simply supported truss can span, or how much uniform load it can carry over a known span. It treats the truss like a deep beam: the top and bottom chords form a force couple, one in compression and one in tension, separated by the truss depth. It is a screening tool for chord strength only and does not replace a full engineering design.
How to use it
Choose whether you want the maximum span or the maximum load. Enter the truss depth between chord centroids in metres, the cross-sectional area of one chord in mm², the material yield or allowable stress in MPa, and a safety factor. Then supply the uniform load in kN/m (to find the span) or the span in metres (to find the load).
The formula explained
The allowable chord force is \(F = \sigma A / SF\). The moment capacity is that force times the depth \(h\):
$$M_{cap} = \frac{\sigma A h}{SF \times 1000}$$For a uniform load \(w\) on a simply supported span \(L\), the peak moment is \(wL^2/8\). Equating the two gives:
$$L_{max} = \sqrt{\frac{8 M_{cap}}{w}}, \qquad w_{max} = \frac{8 M_{cap}}{L^2}$$Here \(M_{cap}\) is in kN·m, \(w\) in kN/m and \(L\) in m.
Worked example
A truss is 1.5 m deep with chords of 1000 mm² in steel with \(\sigma = 250\) MPa and a safety factor of 1.5. The chord force is 250/1.5 × 1000 / 1000 = 166.67 kN.
$$M_{cap} = 166.67 \times 1.5 = 250\,\text{kN}\cdot\text{m}$$$$L_{max} = \sqrt{\frac{8 \times 250}{10}} = \sqrt{200} = 14.14\,\text{m}$$For a 12 m span the load capacity is \(8 \times 250 / 144 = 13.89\) kN/m.
Typical Yield Strengths and Safety Factors by Material
The calculator needs a material stress (MPa) and a safety factor (SF). The table lists commonly used nominal values for truss chord materials. They are indicative only: exact strengths depend on product thickness, grade, temper, moisture and the governing design code.
| Material | Typical yield / allowable stress (MPa) | Typical safety factor range |
|---|---|---|
| Structural steel S235 (EN 10025) | about 235 | about 1.5–2.0 |
| Structural steel S275 (EN 10025) | about 275 | about 1.5–2.0 |
| Structural steel S355 (EN 10025) | about 355 | about 1.5–2.0 |
| ASTM A36 steel (US standard) | about 250 | about 1.5–2.0 |
| Aluminium 6061-T6 | about 240 | about 1.65–2.5 (often higher than steel) |
| Timber (softwood and hardwood grades) | roughly 6–20 allowable bending/tension | about 2.0–4.0 if starting from characteristic strengths; none or less if the value is already an allowable design stress |
Notes:
- Steel and aluminium figures are yield strengths. Timber figures are allowable stresses that vary widely with species, grade, moisture, load duration and member size.
- Do not apply a safety factor twice. Some codes already include partial factors, and some published allowable values already include a reduction.
- This tool checks only chord axial force from overall bending. It does not check buckling, connections, web members, deflection or lateral stability.
- Always check the values against the governing standard for your region (for example Eurocode, AISC or a national timber code) and have a qualified engineer verify real designs.
Span and Capacity Across Different Truss Configurations
All rows use steel at 250 MPa with SF = 1.5, so the allowable stress is \(250/1.5 \approx 166.7\) MPa. The chord force is \(T = \sigma A/(SF \times 1000)\) in kN, the moment capacity is \(M_{cap} = T \cdot h\) in kN·m, and the maximum span is \(L_{max} = \sqrt{8 M_{cap}/w}\).
| Depth h (m) | Chord area A (mm²) | Load w (kN/m) | Chord force T (kN) | M_cap (kN·m) | L_max (m) |
|---|---|---|---|---|---|
| 1.0 | 500 | 5 | 83.3 | 83.3 | 11.55 |
| 1.0 | 500 | 20 | 83.3 | 83.3 | 5.77 |
| 1.0 | 1000 | 10 | 166.7 | 166.7 | 11.55 |
| 1.0 | 2000 | 20 | 333.3 | 333.3 | 11.55 |
| 1.5 | 500 | 20 | 83.3 | 125.0 | 7.07 |
| 1.5 | 1000 | 10 | 166.7 | 250.0 | 14.14 |
| 1.5 | 2000 | 5 | 333.3 | 500.0 | 28.28 |
| 2.0 | 1000 | 5 | 166.7 | 333.3 | 23.09 |
| 2.0 | 2000 | 10 | 333.3 | 666.7 | 23.09 |
| 2.0 | 2000 | 20 | 333.3 | 666.7 | 16.33 |
Example check for the row h = 1.5 m, A = 1000 mm², w = 10 kN/m: \(T = \dfrac{250}{1.5}\cdot\dfrac{1000}{1000} = 166.7\) kN, \(M_{cap} = 166.7 \times 1.5 = 250\) kN·m, and \(L_{max} = \sqrt{8 \times 250 / 10} = \sqrt{200} \approx 14.14\) m.
Because \(L_{max} = \sqrt{8M/w}\) and \(M\) is proportional to depth and chord area, the maximum span grows with the square root of depth and of chord area, and falls with the square root of load. Doubling the depth increases the span by only about 41% (a factor of \(\sqrt{2}\)), and quadrupling the load halves it. These are simplified screening results for a simply supported truss under uniform load, not a substitute for a full structural design.
FAQ
Does this check buckling or deflection?
No. Compression chord buckling, web members, connections and deflection often govern, especially when the span-to-depth ratio exceeds about 20. Always verify with a full structural analysis.
Does the load include self-weight?
Enter the total design load including the truss self-weight, roof or floor dead load and live load.
What span-to-depth ratio is typical?
Simply supported trusses commonly have span-to-depth ratios between 6 and 20.