What this calculator does
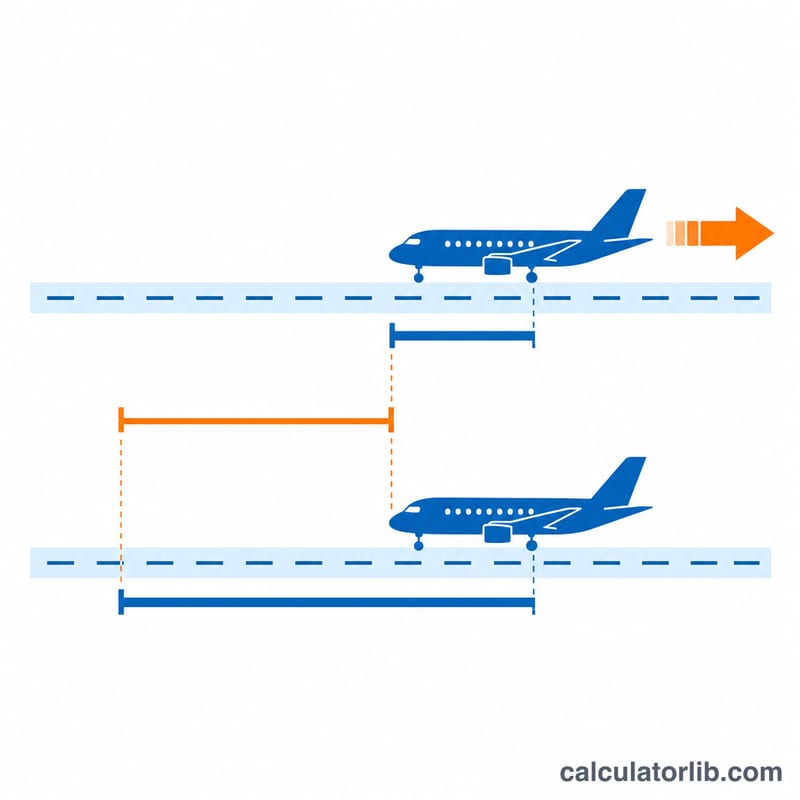
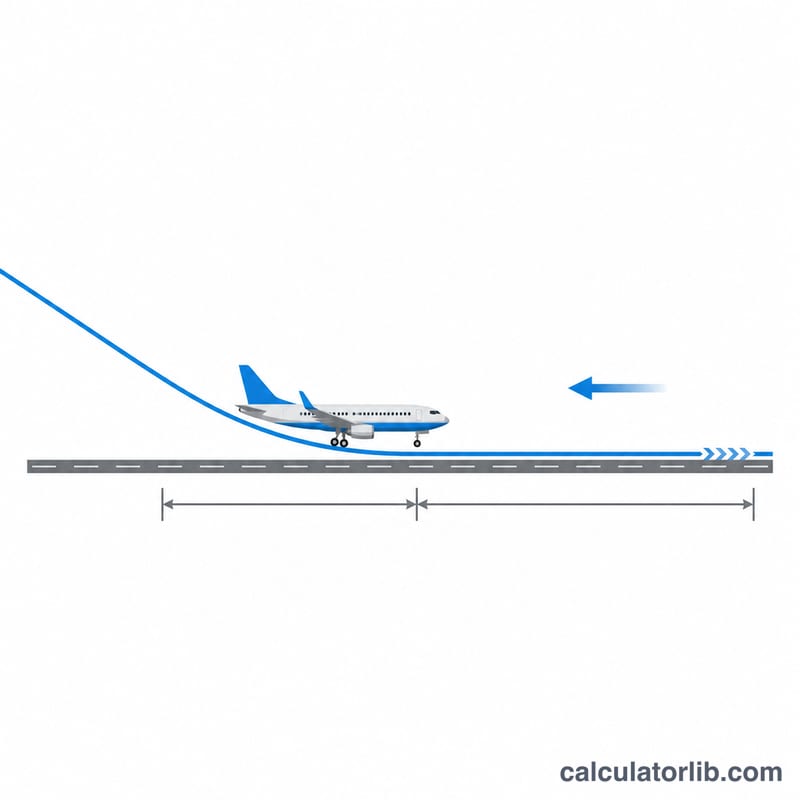
The aircraft landing distance calculator estimates how much runway an aircraft needs to touch down and come to a full stop. It combines the float (air) distance during the flare with the braking ground roll, then applies an optional safety factor, as is common in operational planning. It is a physics-based teaching and planning estimate, not a replacement for the approved flight manual.
How to use it
Enter the touchdown airspeed in knots, the headwind component (use a negative number for a tailwind), an effective braking coefficient, the runway slope in percent (positive for uphill), the flare time in seconds, and the safety factor. Typical braking coefficients are about 0.4 for dry pavement with moderate braking, 0.2 for wet and 0.1 or less for icy surfaces. A safety factor of 1.67 mimics the common 60% dry-runway rule.
The formula explained
Touchdown ground speed is airspeed minus headwind, converted to metres per second. With constant deceleration, the ground roll is:
$$s_{\text{roll}} = \frac{V_g^2}{2\,g\,(\mu + G)}$$where \(V_g\) is ground speed in m/s, \(g = 9.80665\ \text{m/s}^2\), \(\mu\) is the effective braking coefficient and \(G\) is the runway gradient as a fraction. The air distance is \(V_g \, t_{\text{flare}}\), and the required runway is \(K\,(s_{\text{roll}} + V_g t_{\text{flare}})\).
Worked example
Touchdown at 130 kt with a 10 kt headwind gives \(V_g = 120\ \text{kt} = 61.73\ \text{m/s}\). With \(\mu = 0.4\) and a level runway:
$$s_{\text{roll}} = \frac{61.73^2}{2 \times 9.80665 \times 0.4} = 485.8\ \text{m}$$With a 3 s flare, the air distance is \(61.73 \times 3 = 185.2\) m, so the actual distance is about 671 m. Multiplying by \(K = 1.67\) gives roughly 1,121 m of required runway.
Landing Distance Under Different Conditions
All rows use the same touchdown airspeed of 130 kt, a flare time of 3 s and a safety factor K = 1.67. Only headwind, braking coefficient and slope change. The formula is \(D = K\left(\frac{v_g^2}{2a} + v_g t_{flare}\right)\), with \(v_g = 0.514444\,(V_{td} - V_{headwind})\) and \(a = 9.80665\,(\mu + \text{slope}/100)\). A positive headwind value is a headwind, a negative value is a tailwind. A positive slope is uphill, which shortens the roll, and a negative slope is downhill. Ground roll and air distance are unfactored. Required runway is the factored total \(D\).
| Case | Headwind (kt) | Braking coeff. | Slope (%) | Ground speed (m/s) | Ground roll (m / ft) | Air distance (m / ft) | Required runway (m / ft) |
|---|---|---|---|---|---|---|---|
| Baseline, dry | 0 | 0.4 | 0 | 66.88 | 570 / 1,870 | 201 / 658 | 1287 / 4,223 |
| 10 kt headwind | +10 | 0.4 | 0 | 61.73 | 486 / 1,594 | 185 / 608 | 1,121 / 3,676 |
| 10 kt tailwind | -10 | 0.4 | 0 | 72.02 | 661 / 2,169 | 216 / 709 | 1,465 / 4,806 |
| Wet runway | 0 | 0.2 | 0 | 66.88 | 1,140 / 3,741 | 201 / 658 | 2,239 / 7,346 |
| Icy runway | 0 | 0.1 | 0 | 66.88 | 2,280 / 7,482 | 201 / 658 | 4143 / 13,594 |
| Downhill 2%, dry | 0 | 0.4 | -2 | 66.88 | 600 / 1,969 | 201 / 658 | 1,337 / 4,387 |
| Uphill 2%, dry | 0 | 0.4 | +2 | 66.88 | 543 / 1,781 | 201 / 658 | 1,242 / 4,074 |
| Worst combination | -10 | 0.2 | -2 | 72.02 | 1,469 / 4,821 | 216 / 709 | 2,815 / 9,234 |
Worked check (baseline row): \(v_g = 0.514444 \times 130 = 66.878\) m/s and \(a = 9.80665 \times 0.4 = 3.9227\) m/s². Then \(D = 1.67\left(\frac{66.878^2}{2 \times 3.9227} + 66.878 \times 3\right) = 1.67\,(570.1 + 200.6) \approx 1{,}287\) m, which is about 4,223 ft.
These are simplified planning estimates, not certified performance data. Real landing distances come from the aircraft flight manual.
Typical Braking Coefficients by Runway Surface
The calculator uses a single effective braking coefficient \(\mu\), which is the average deceleration as a fraction of g. These are simplified planning values.
| Surface condition | Effective braking coefficient \(\mu\) | Rough braking action category |
|---|---|---|
| Dry, moderate braking | about 0.4 | Good |
| Wet | about 0.2 | Often medium, depending on texture and water depth |
| Icy | 0.1 or less | Poor |
Reported braking action: runway reports usually describe braking as good, medium or poor, and some reporting systems add intermediate steps such as good to medium and medium to poor. The mapping above is only a rough guide. Reported braking action comes from pilot reports or friction-measuring devices, and those readings are not the same quantity as the effective deceleration coefficient used here. Standing water, slush and snow can make braking much worse than a simple wet value, and hydroplaning can reduce braking further.
Important: these are simplified planning values, not certified data. Use the approved aircraft performance data and current runway condition reports for any real operational decision.
Knots, m/s and Distance Conversions
- 1 kt = 0.514444 m/s
- 1 kt = 1.852 km/h (exactly one nautical mile per hour)
- 1 m = 3.28084 ft
- 1 ft = 0.3048 m
Common touchdown speeds
| Speed (kt) | Speed (m/s) | Speed (km/h) |
|---|---|---|
| 60 | 30.867 | 111.1 |
| 80 | 41.156 | 148.2 |
| 100 | 51.444 | 185.2 |
| 130 | 66.878 | 240.8 |
| 150 | 77.167 | 277.8 |
Runway lengths
| Length (m) | Length (ft) |
|---|---|
| 1,000 | 3,281 |
| 1,500 | 4,921 |
| 2,000 | 6,562 |
| 3,000 | 9,843 |
To convert a speed for the formula, multiply knots by 0.514444. For example, \(130 \times 0.514444 = 66.878\) m/s.
FAQ
Why does a headwind shorten the landing?
Distance depends on the square of ground speed, so even a modest headwind reduces the energy to dissipate and shortens the roll noticeably. A tailwind does the opposite.
Does aircraft weight matter?
In reality, weight affects approach speed and brake energy. Here you capture it through the touchdown speed you enter, since a heavier aircraft lands faster.
Is the result safe for flight planning?
No. Use the aircraft flight manual, current runway condition reports and your operator procedures for real operations.