
What is the "At Least k Successes" Binomial Calculator?
This tool computes the probability of obtaining at least k successes in n independent trials, where each trial succeeds with the same probability p. This is the upper-tail cumulative probability of the binomial distribution, written \(P(X \geq k)\). It is widely used in quality control, reliability testing, A/B testing, polling, and any scenario built from repeated yes/no (Bernoulli) trials.
How to Use It
Enter three values: the number of trials n (a whole number), the minimum number of successes k you care about, and the per-trial success probability p as a decimal between 0 and 1 (for example 0.25 for 25%). Press calculate to see \(P(X \geq k)\), the same value as a percentage, plus the exact-k probability \(P(X = k)\) and the lower tail \(P(X \leq k)\).
The Formula Explained
The probability of exactly i successes is the binomial mass function \(C(n, i) \cdot p^{i} \cdot (1-p)^{n-i}\), where \(C(n, i)\) is the number of ways to choose which trials succeed. To get "at least k," we sum every term from \(i = k\) up to \(i = n\):
$$P(X \geq k) = \sum_{i=k}^{n} \binom{n}{i}\, p^{\,i}\,\left(1-p\right)^{n-i}$$
The calculator builds each term iteratively for numerical stability rather than computing large factorials directly, so it stays accurate even for large n.
Worked Example
Suppose you flip a fair coin (\(p = 0.5\)) 10 times and want the chance of getting at least 6 heads. With \(n = 10\), \(k = 6\), \(p = 0.5\), the sum of terms for \(i = 6, 7, 8, 9, 10\) equals $$\frac{386}{1024} \approx 0.376953,$$ or about 37.7%.
Interpreting Your Result
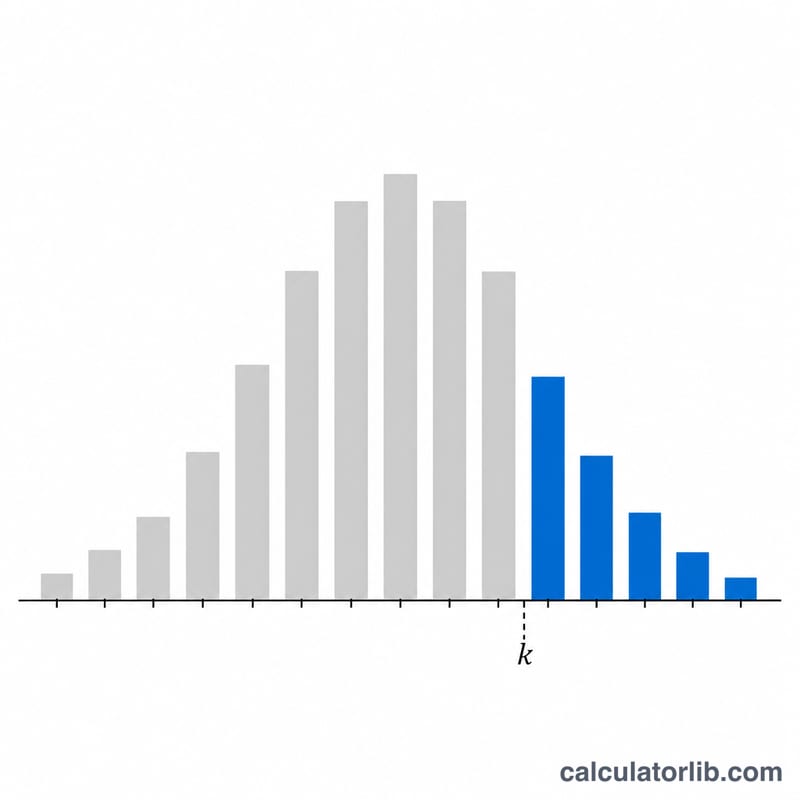
\(P(X \geq k)\) is a one-sided (upper-tail) probability: it answers "if the true success rate really is \(p\), how often would I see \(k\) or more successes in \(n\) trials, just by chance?" It bundles together every outcome from exactly \(k\) successes up through all \(n\).
A small result — for example below 0.05 — means the observed count of successes would be surprising under the assumed \(p\). That is exactly the logic behind a one-sided p-value: if you assume a baseline rate and your data lands far in the tail, the assumption looks doubtful. A large result means the count is unremarkable and entirely consistent with the assumed \(p\).
- A/B testing. If the control conversion rate is \(p\) and the variant produced \(k\) of \(n\) conversions, \(P(X \geq k)\) gauges whether the lift could just be noise. A tiny tail probability is evidence the variant genuinely differs.
- Quality control / acceptance sampling. With an assumed defect rate \(p\), \(P(X \geq k)\) is the chance a lot shows \(k\) or more defectives in a sample of \(n\) — the foundation of accept/reject rules.
- Reliability "at least one". Setting \(k=1\) gives the probability that at least one event occurs across \(n\) independent attempts.
For large \(n\), the binomial tail is often approximated by a normal distribution, so a normal upper-tail tool can serve as a sanity check once \(np\) and \(n(1-p)\) are both comfortably above about 10. Treat the number as a description of how compatible your data is with the assumed \(p\); choosing a threshold for action is a study-design decision, not something the probability dictates on its own.
Definitions & Glossary
- \(n\) — number of trials
- The fixed total count of independent repetitions of the experiment (e.g. 20 coin flips, 100 sampled parts).
- \(k\) — minimum number of successes
- The threshold being tested. \(P(X \geq k)\) sums the probabilities of getting exactly \(k, k+1, \dots, n\) successes.
- \(p\) — per-trial success probability
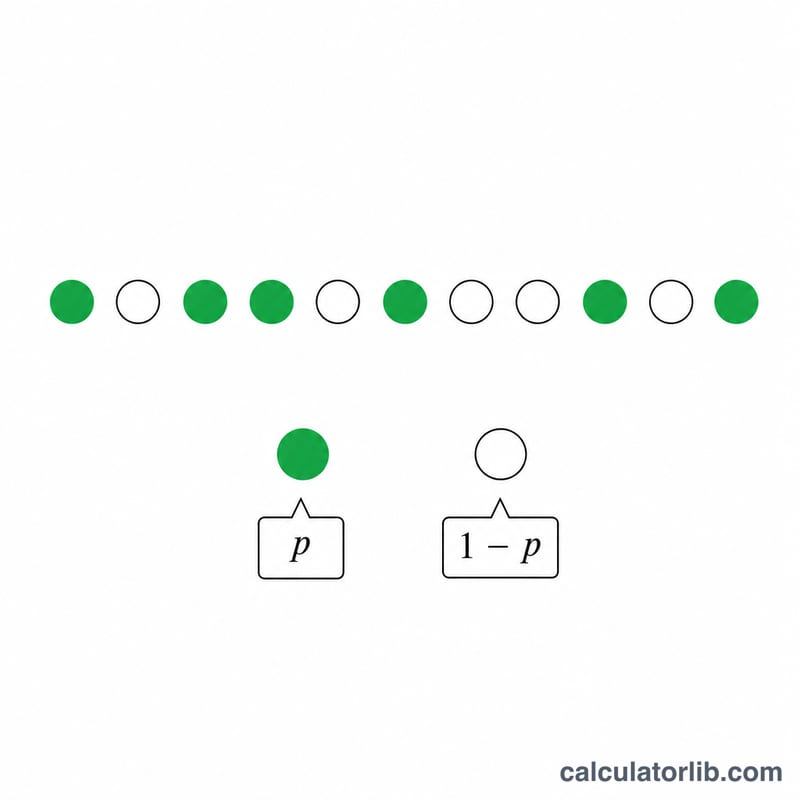
- The probability that any single trial is a "success," assumed identical for every trial. It lies between 0 and 1.
- Bernoulli trial
- A single experiment with exactly two outcomes — success (probability \(p\)) or failure (probability \(1-p\)). A binomial setting is \(n\) identical, independent Bernoulli trials.
- Binomial coefficient \(\binom{n}{i}\)
- "\(n\) choose \(i\)," the number of distinct ways to arrange \(i\) successes among \(n\) trials: \(\binom{n}{i} = \dfrac{n!}{i!\,(n-i)!}\).
- Cumulative / upper-tail probability
- A probability that aggregates a range of outcomes. \(P(X \geq k)\) is the upper tail — it adds the chances of all counts from \(k\) up to \(n\). Its complement is \(P(X \leq k-1)\).
- Independence
- The assumption that the outcome of one trial does not influence any other. Without independence (and a constant \(p\)), the binomial formula does not apply.
FAQ
Does this assume independent trials? Yes. Each trial must be independent and have the same success probability \(p\).
What if I want exactly k or at most k? The result table also shows \(P(X = k)\) and \(P(X \leq k)\) for convenience.
Can p be a percentage? Enter p as a decimal (e.g. 0.05 for 5%), not as 5.


