
What Is the Average Return Calculator?
This calculator measures how much an investment grew on average each year. It reports the annualized average return, also known as the compound annual growth rate (CAGR), which smooths out the total gain over the holding period into a single yearly percentage. This is the most accurate way to compare investments held for different lengths of time.
How to Use It
Enter three values: the starting value of your investment, the ending value, and the number of years you held it. The calculator returns the annualized return (CAGR), the total return over the whole period, a simple average per year, and the total dollar gain.
The Formula Explained
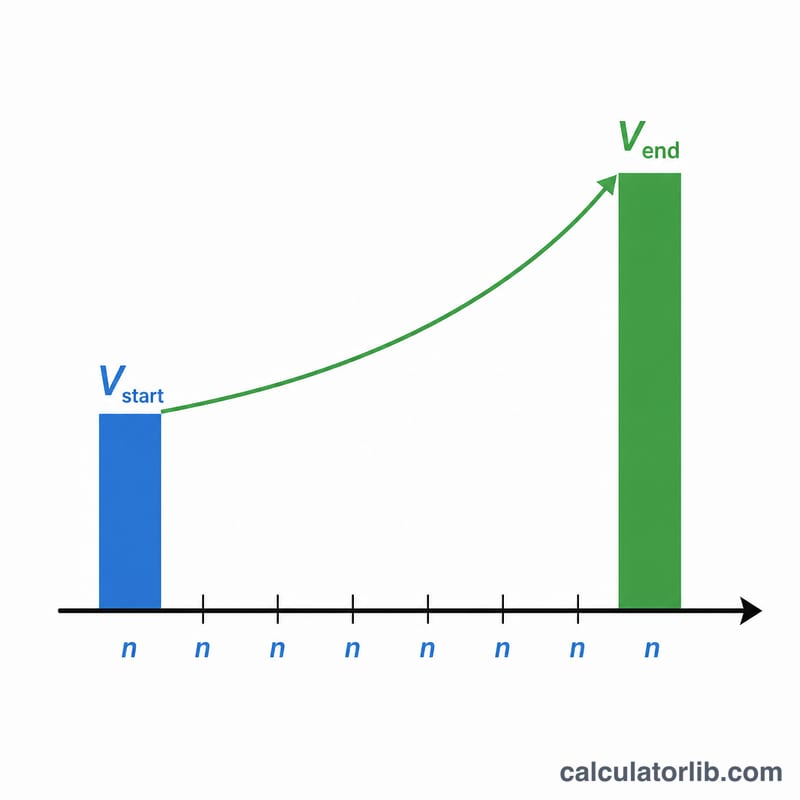
The annualized return uses the formula $$r = \left(\frac{V_{end}}{V_{start}}\right)^{1/n} - 1$$ The ratio of ending to starting value gives the growth multiple, raising it to the power of \(1/n\) converts that multiple into a per-year rate, and subtracting 1 expresses it as a percentage change. Unlike a simple average, CAGR accounts for compounding.
Worked Example
Suppose you invested $1,000 and it grew to $2,000 over 5 years. The growth multiple is \(2{,}000 / 1{,}000 = 2\). Raising 2 to the power \(1/5\) gives about $$2^{1/5} \approx 1.1487$$ so the annualized return is about 14.87% per year. The total return is 100%, and the total gain is $1,000.
Interpreting Your Result
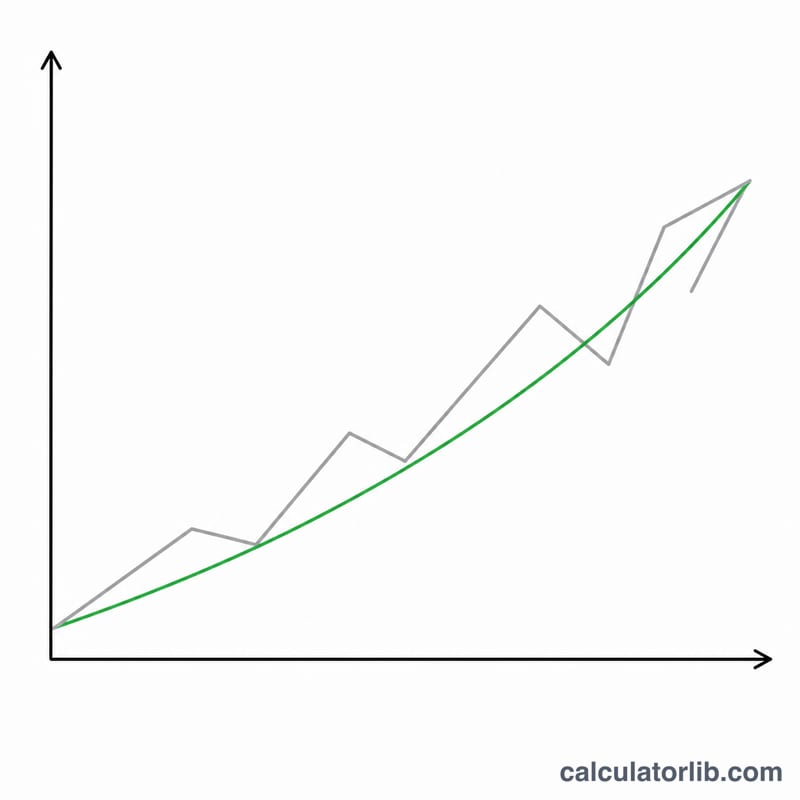
The compound annual growth rate (CAGR) is the single constant annual rate that would have grown your starting value into your ending value over the holding period, with each year's gain compounding on the previous balance. It is a smoothed, average figure — not a record of what actually happened in any individual year.
Because it is smoothed, CAGR ignores volatility. An investment that gained 50% one year and lost 25% the next can have the same CAGR as one that crept up steadily. The annualized figure tells you the net effect over the whole period but says nothing about the bumpiness of the path. It also assumes only a single start and end value: it does not account for interim cash flows such as additional deposits, withdrawals, or reinvested dividends. If money was added or removed during the period, CAGR on the raw start/end values will misstate the actual return on invested capital — a money-weighted measure (IRR) is more appropriate there.
CAGR also differs from a simple average of yearly returns. The simple average adds each year's percentage return and divides by the number of years; it is always equal to or higher than the CAGR whenever returns vary, because it does not penalize the drag created by losses. CAGR (a geometric average) reflects the true accumulated wealth.
To benchmark a result, compare it against widely cited reference rates over a comparable horizon. Common reference points include the prevailing rate of inflation (so you can judge real versus nominal growth), the yield on cash or short-term government instruments, and the long-run average return of a broad stock-market index. A CAGR below the inflation rate means purchasing power was lost even if the nominal balance rose. These are general comparisons only and are not investment advice or a prediction of future results.
Key Terms Defined
- CAGR / Annualized Return
- The constant yearly rate at which the starting value would have to grow, compounding each year, to reach the ending value over the holding period. Calculated as \(\left[\left(V_{end}/V_{start}\right)^{1/n}-1\right]\times100\%\).
- Total Return
- The overall percentage change from start to finish, ignoring time: \(\left(V_{end}/V_{start}-1\right)\times100\%\). A $1,000 investment ending at $2,000 has a total return of +100%.
- Simple Average Return
- The arithmetic mean of the individual yearly returns. Unlike CAGR, it does not compound and tends to overstate accumulated growth when returns fluctuate.
- Holding Period (n)
- The length of time the investment was held, expressed in years. It is the exponent's denominator in the CAGR formula; partial years can be entered as decimals (e.g. 1.5 years).
- Growth Multiple
- The ratio \(V_{end}/V_{start}\). A multiple of 2.0 means the value doubled; 1.3 means it grew 30%; below 1.0 indicates a loss.
- Starting Value (Vstart)
- The amount invested or the value of the investment at the beginning of the holding period.
- Ending Value (Vend)
- The value of the investment at the end of the holding period, including any reinvested gains.
FAQ
Why is CAGR different from a simple average? CAGR accounts for compounding, while a simple average just divides the total return by the number of years and ignores how gains build on previous gains.
Can I use it for losses? Yes — if the ending value is lower than the starting value, the calculator returns a negative annualized return.
What if I held the investment less than a year? Enter a fractional year, such as 0.5 for six months, and the formula still works.