
What this calculator does
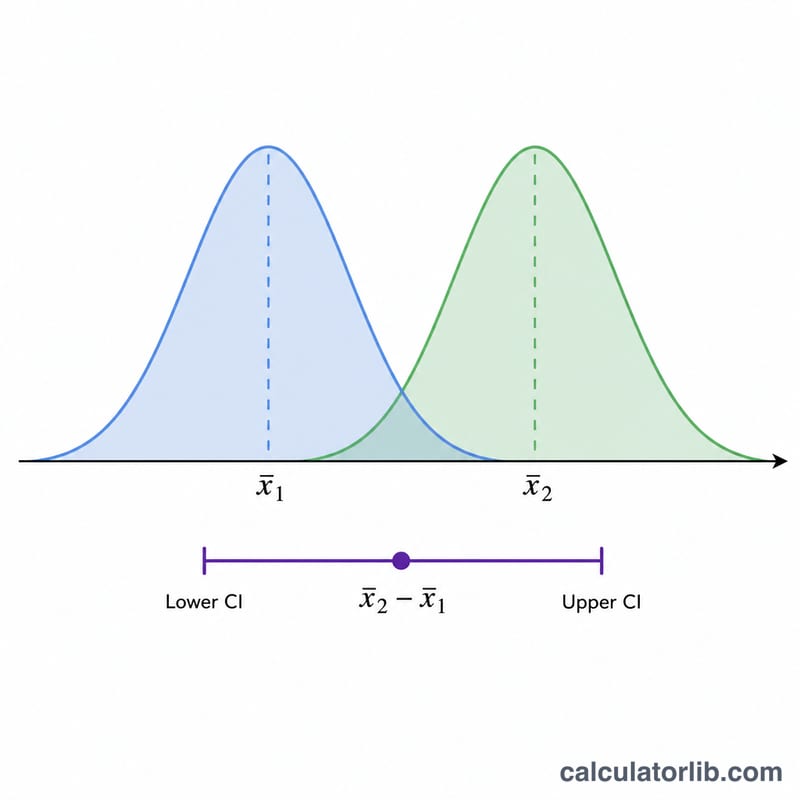
This tool estimates a confidence interval for the difference between two independent population means, \(\mu_1 - \mu_2\). It uses the Welch (unpooled) two-sample t-method, which does not assume the two groups have equal variances, making it the safest default for most real data.
How to use it
Enter the sample mean, sample standard deviation, and sample size for each of your two groups, then choose a confidence level (90%, 95%, or 99%). The calculator returns the point estimate \((\bar{x}_1 - \bar{x}_2)\), the margin of error, the standard error, the t critical value, the Welch degrees of freedom, and the lower and upper bounds of the interval.
The formula explained
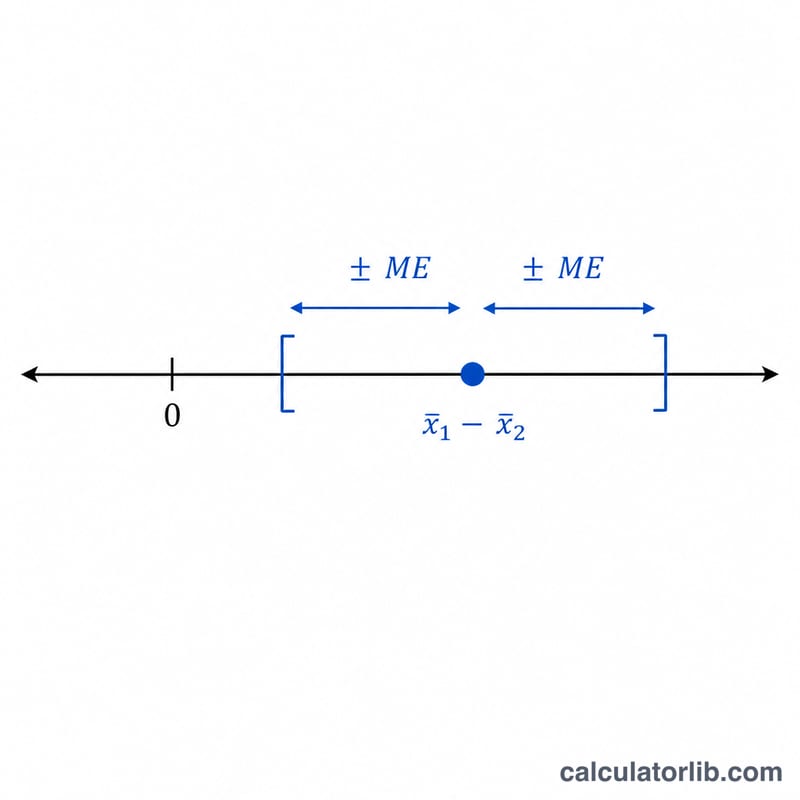
The interval is centered on the difference of the two sample means. The half-width (margin of error) is the t critical value times the standard error, where the standard error combines both groups:
$$\text{SE} = \sqrt{\dfrac{s_1^{2}}{n_1} + \dfrac{s_2^{2}}{n_2}}$$The degrees of freedom come from the Welch-Satterthwaite approximation, and the t critical value is found for the chosen two-sided confidence level. A wider interval reflects more uncertainty; larger samples and smaller standard deviations shrink it.
Worked example
Suppose group 1 has \(\bar{x}_1 = 10\), \(s_1 = 2.5\), \(n_1 = 30\), and group 2 has \(\bar{x}_2 = 8\), \(s_2 = 3.0\), \(n_2 = 30\), at 95% confidence. The difference is 2.
$$\text{SE} = \sqrt{\dfrac{6.25}{30} + \dfrac{9}{30}} = \sqrt{0.5083} \approx 0.7130$$The Welch \(df \approx 56.2\), giving \(t \approx 2.003\). Margin \(\approx 1.428\), so the 95% interval is about \(0.572\) to \(3.428\). Because the interval excludes 0, the means differ significantly at the 5% level.
FAQ
Should I use pooled or unpooled variance? This calculator uses the unpooled (Welch) method, which is recommended unless you are confident the two population variances are equal.
What does it mean if the interval contains 0? If 0 lies inside the interval, the data are consistent with no real difference between the two means at that confidence level.
Why is the t value not exactly from a table? The critical value is computed with a high-accuracy numerical approximation; it matches standard t-tables to several decimal places.