
What the HOMA-IR Calculator Does
HOMA-IR (Homeostatic Model Assessment of Insulin Resistance) is a simple, widely used index that estimates how resistant your body is to insulin using two routine fasting blood values. This calculator uses the standard "405" formula, which assumes glucose is measured in mg/dL (the unit used in the United States and several other countries). Enter your fasting numbers and the tool returns your HOMA-IR score along with two helpful extras: an insulin sensitivity value and the QUICKI index.
The Inputs You Enter
- Fasting Insulin (µIU/mL): your fasting serum insulin from a blood test, taken after at least 8 hours without food.
- Fasting Glucose (mg/dL): your fasting blood glucose, measured at the same time.
Both must come from the same fasting blood draw for the result to be meaningful.
The Formula Explained
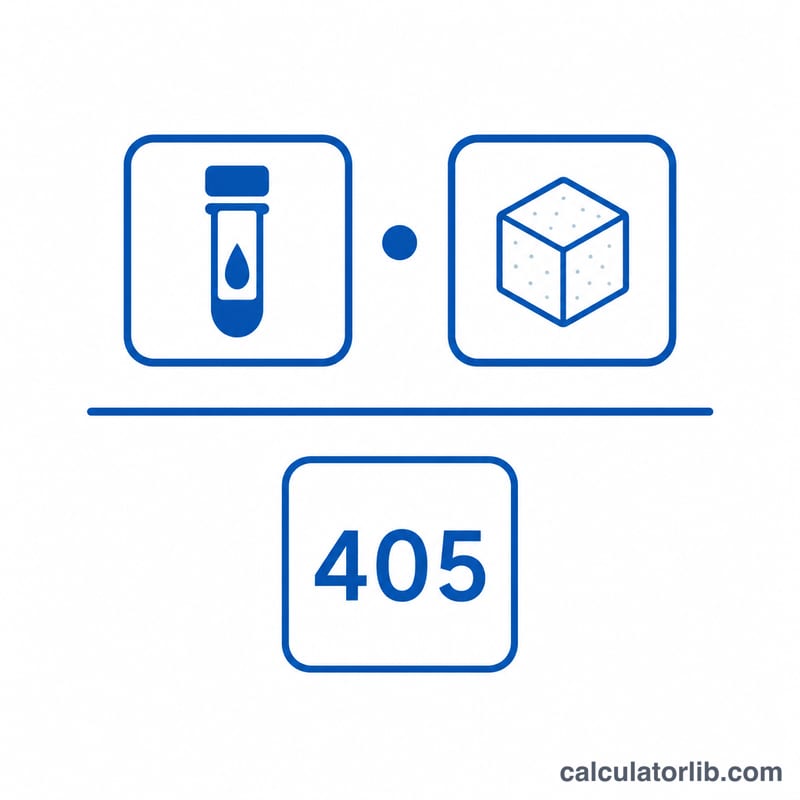
The core calculation is:
$$\text{HOMA-IR} = \frac{\text{Fasting Insulin} \times \text{Fasting Glucose}}{405}$$
The fixed constant 405 reflects the use of glucose in mg/dL (if glucose were in mmol/L, the divisor would be 22.5). The calculator also derives:
- Insulin sensitivity \(= 1 \div \text{HOMA-IR}\) — a quick reciprocal measure where higher is better.
- \(\text{QUICKI} = \dfrac{1}{\log_{10}\text{insulin} + \log_{10}\text{glucose}}\) — a log-transformed sensitivity index.
Worked Example
Suppose your fasting insulin is 10 µIU/mL and fasting glucose is 90 mg/dL:
- $$\text{HOMA-IR} = \frac{10 \times 90}{405} = \frac{900}{405} = \mathbf{2.22}$$
- Insulin sensitivity \(= 1 \div 2.22 = 0.45\)
- $$\text{QUICKI} = \frac{1}{\log_{10}10 + \log_{10}90} = \frac{1}{1 + 1.954} = \mathbf{0.339}$$
A HOMA-IR of 2.22 falls in the "significant insulin resistance" band, and the QUICKI of 0.339 indicates low insulin sensitivity.
How the Results Are Interpreted
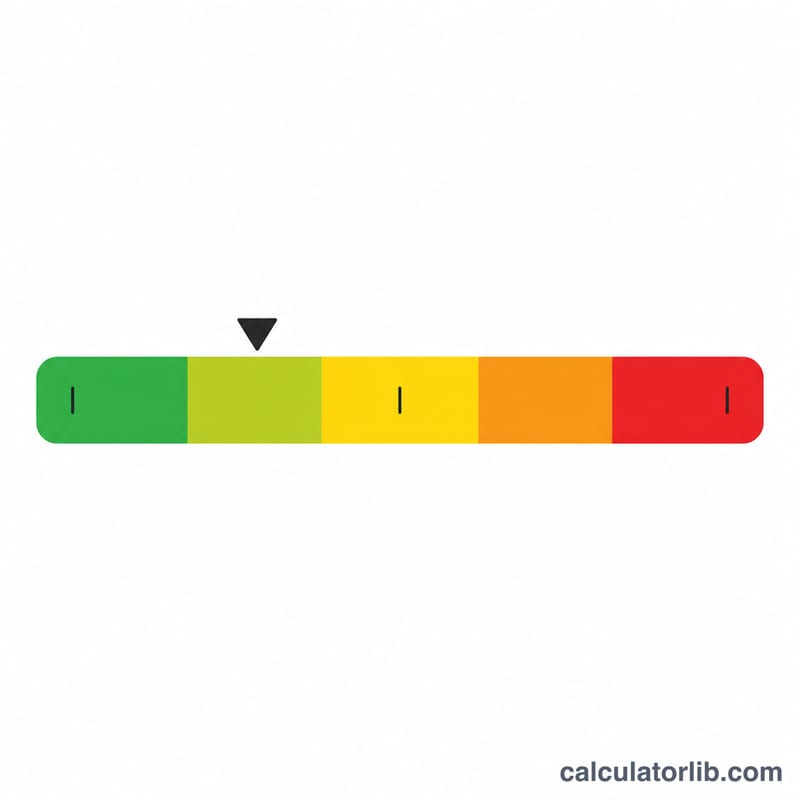
- Below 1: Normal insulin sensitivity
- 1 to 1.9: Early insulin resistance
- 1.9 to 2.9: Significant insulin resistance
- 2.9 and above: Severe insulin resistance
For QUICKI, above 0.45 is high sensitivity, 0.38–0.45 is normal, and below 0.38 suggests insulin resistance.
HOMA-IR Across Common Fasting Scenarios
The table below applies the formula \(\text{HOMA-IR} = (\text{Insulin} \times \text{Glucose}) / 405\) to realistic fasting insulin (µIU/mL) and glucose (mg/dL) pairs. Interpretive bands vary by laboratory and population; the labels here use commonly cited cut-offs (roughly: under 1.0 optimal, up to ~2.0 normal, ~2.0–2.9 early/developing resistance, ~3.0 and above significant, with markedly higher values reflecting severe resistance).
| Fasting Insulin (µIU/mL) | Fasting Glucose (mg/dL) | Calculation | HOMA-IR | Band |
|---|---|---|---|---|
| 5 | 85 | (5 × 85) / 405 | 1.05 | Normal / optimal |
| 8 | 90 | (8 × 90) / 405 | 1.78 | Normal |
| 12 | 100 | (12 × 100) / 405 | 2.96 | Early insulin resistance |
| 18 | 110 | (18 × 110) / 405 | 4.89 | Significant resistance |
| 25 | 130 | (25 × 130) / 405 | 8.02 | Severe resistance |
These figures are illustrative estimates, not a diagnosis. Always interpret HOMA-IR alongside your lab's reference ranges and a clinician's assessment. This is general information, not professional medical advice.
Frequently Asked Questions
Why is glucose in mg/dL? This calculator uses the 405 divisor, which is calibrated for mg/dL. If your lab reports glucose in mmol/L, convert it to mg/dL first (multiply by 18) or use a mmol/L version with a divisor of 22.5.
What HOMA-IR is "good"? Generally, lower is better. A value under 1 reflects strong insulin sensitivity, while rising numbers signal increasing resistance. Reference ranges vary by lab and population.
Can this diagnose diabetes? No. HOMA-IR is a screening and research-oriented estimate, not a diagnosis. Discuss your results with a healthcare professional, especially before making any treatment decisions.
Related calculators
- QUICKI Calculator — insulin sensitivity from fasting glucose & insulin.
- eGFR Calculator — kidney function from creatinine.
- BMI Calculator — body mass index from height & weight.