
What Is the Savings Erosion Calculator?
Money that sits idle does not stay still in real terms. Even modest inflation steadily chips away at what your savings can actually buy. This calculator shows the real future value of a lump sum — that is, how much purchasing power it will hold after a number of years of inflation, expressed in today's money. It works for any currency since the math is purely percentage-based.
How to Use It
Enter three values: your current savings amount, the annual inflation rate you expect (as a percentage), and the number of years you want to look ahead. The calculator returns the inflation-adjusted real value, the amount of purchasing power lost, and the erosion as a percentage of the original sum.
The Formula Explained
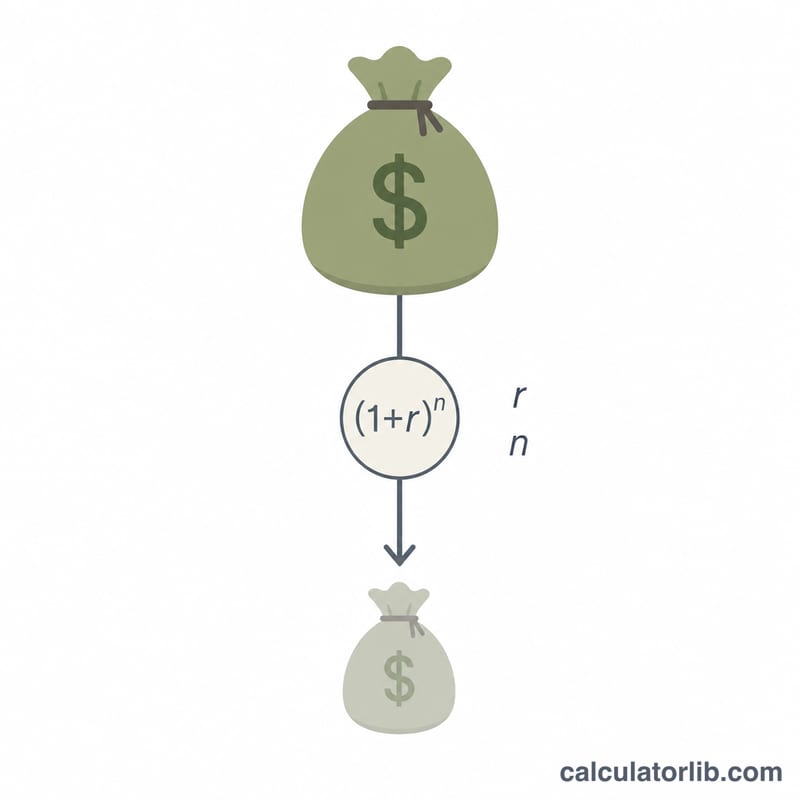
The core equation is:
$$\text{Real Value} = \dfrac{\text{Savings}}{\left(1 + \dfrac{\text{Inflation \%}}{100}\right)^{\text{Years}}}$$
where \(r\) is the inflation rate written as a decimal (3% → 0.03) and \(n\) is the number of years. Because inflation compounds, each year multiplies the price level by \((1 + r)\), so dividing by that factor raised to the power of \(n\) converts a future nominal amount back into today's purchasing power.
Worked Example
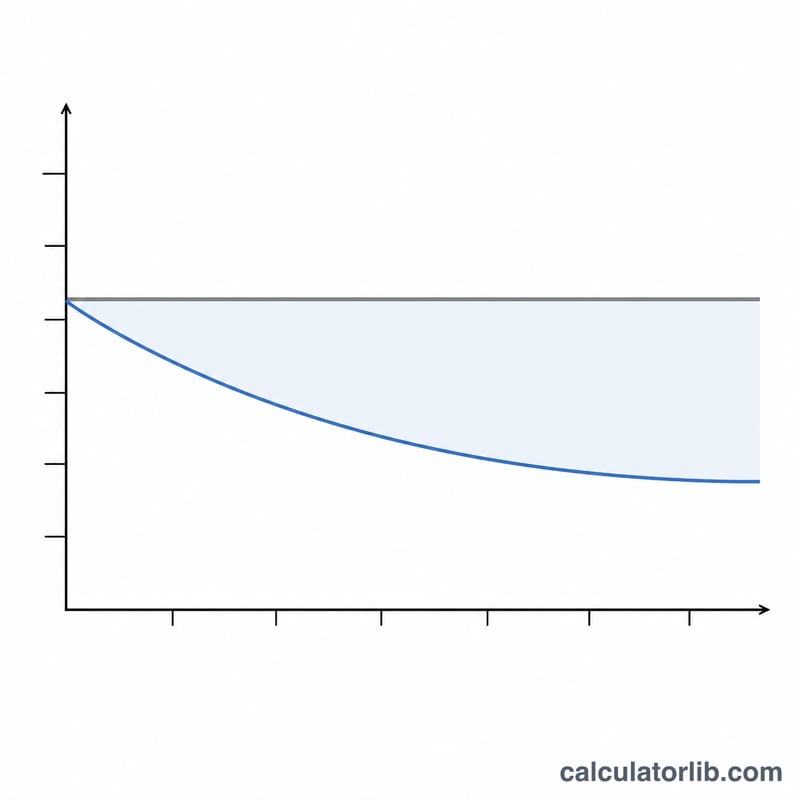
Suppose you keep $10,000 in a non-interest account and inflation runs at 3% per year for 10 years. The discount factor is \((1.03)^{10} \approx 1.34392\). So the real value is $$10{,}000 \div 1.34392 \approx \$7{,}440.94$$ That means roughly $2,559.06 — about 25.6% — of purchasing power has quietly evaporated.
FAQ
Does this account for interest earned? No. It assumes the savings earn nothing. If your savings grow, compare the growth rate to inflation to find the real return.
What inflation rate should I use? A long-run average of 2–3% is common in developed economies, but use your own outlook or historical local data.
Is this the same as future value? No — standard future value grows a sum forward; this discounts a sum to reveal lost purchasing power.