What Is the Mode?
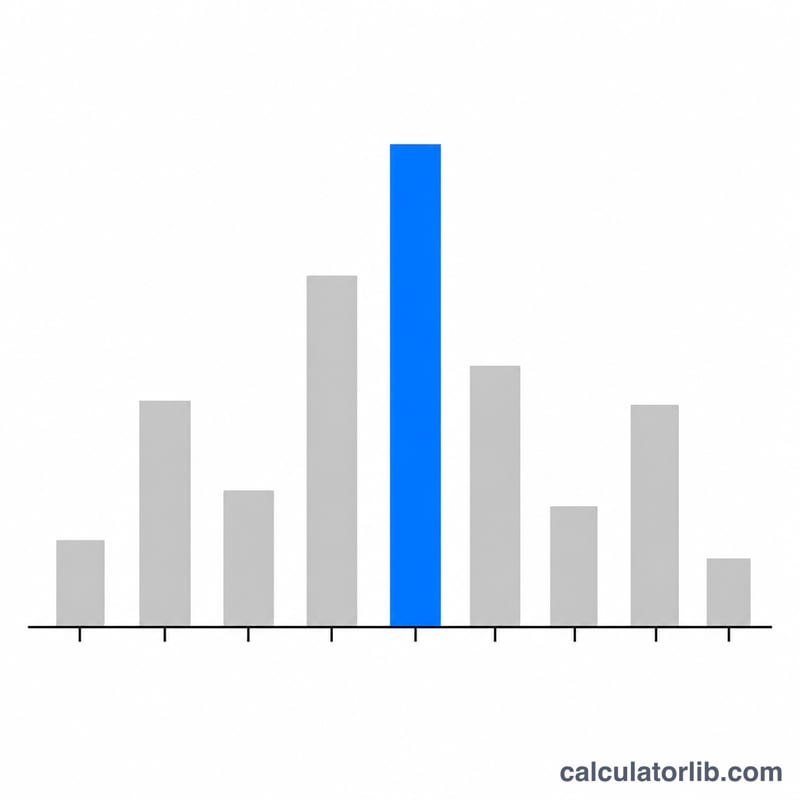
The mode is the value that appears most often in a data set. Unlike the mean (average) or median (middle value), the mode focuses purely on frequency. It is the only measure of central tendency that works with categorical as well as numerical data, and it is useful for spotting the most common or most popular item in a collection.
How to Use This Calculator
Type your numbers into the box, separated by commas or spaces — for example 2, 4, 4, 4, 6, 6, 9. Press calculate and the tool counts how often each value occurs, then reports the value(s) with the highest count along with that frequency, the number of modes, and the total count of values entered.
The Formula Explained
Mathematically, the mode is the value x that maximizes the frequency function f(x):
$$\text{Mode} = \underset{x \,\in\, \text{Numbers}}{\arg\max}\; \operatorname{freq}(x)$$
If two or more values tie for the highest frequency, the set is multimodal and all of them are modes. If every value appears the same number of times (each just once), the set has no mode.
Worked Example
Consider the set 2, 4, 4, 4, 6, 6, 9. The value 4 appears three times, 6 appears twice, and 2 and 9 each appear once. The highest frequency is 3, achieved only by 4, so the mode is 4. There are 7 values in total and exactly one mode.
FAQ
Can a data set have more than one mode? Yes. If several values share the highest frequency, the set is bimodal (two modes) or multimodal (more), and all tied values are reported.
What if there is no repeated value? When every value appears only once, there is no mode — no value stands out as most frequent.
Does the mode have to be a number? In this calculator, yes, but conceptually the mode can apply to categories too, such as the most common eye color in a survey.


