
What This Calculator Does
The Mean, Median & Mode Calculator analyses a list of numbers and reports the three classic measures of central tendency — the mean (average), the median (middle value) and the mode (most frequent value). It also returns useful extras: the count, sum, range, minimum and maximum, giving you a quick statistical summary of any dataset.
How to Use It
Type or paste your numbers into the box, separated by commas or spaces (for example 4, 8, 15, 16, 23, 42). Decimals and negative numbers are supported. Press calculate and the tool sorts the data, computes each statistic and displays them together.
The Formulas Explained
The mean is the sum of every value divided by how many values there are: mean = \(\Sigma x / n\). The median is found by sorting the data and taking the middle value; with an even count it is the average of the two central values. The mode is the value that appears most often — a dataset can have one mode, several modes, or none if every value is unique.
$$\text{Mean} = \frac{\sum_{i=1}^{n} x_i}{n} \qquad \text{where } x_i \in \text{Numbers},\ n = \text{count}$$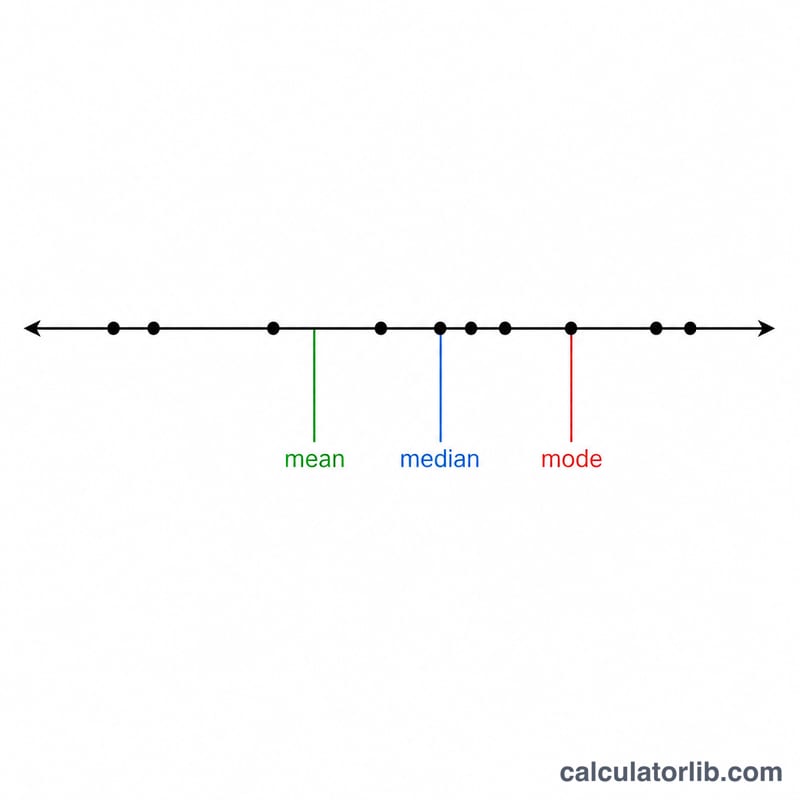
Worked Example
Consider 2, 4, 4, 4, 5, 5, 7, 9 (\(n = 8\)). The sum is 40, so the mean = \(40 / 8 = 5\). Sorted, the two middle values (positions 4 and 5) are 4 and 5, so the median = \((4 + 5) / 2 = 4.5\). The value 4 appears three times — more than any other — so the mode = 4. The range is \(9 - 2 = 7\).
$$\text{mean} = \frac{40}{8} = 5$$$$\text{median} = \frac{4 + 5}{2} = 4.5$$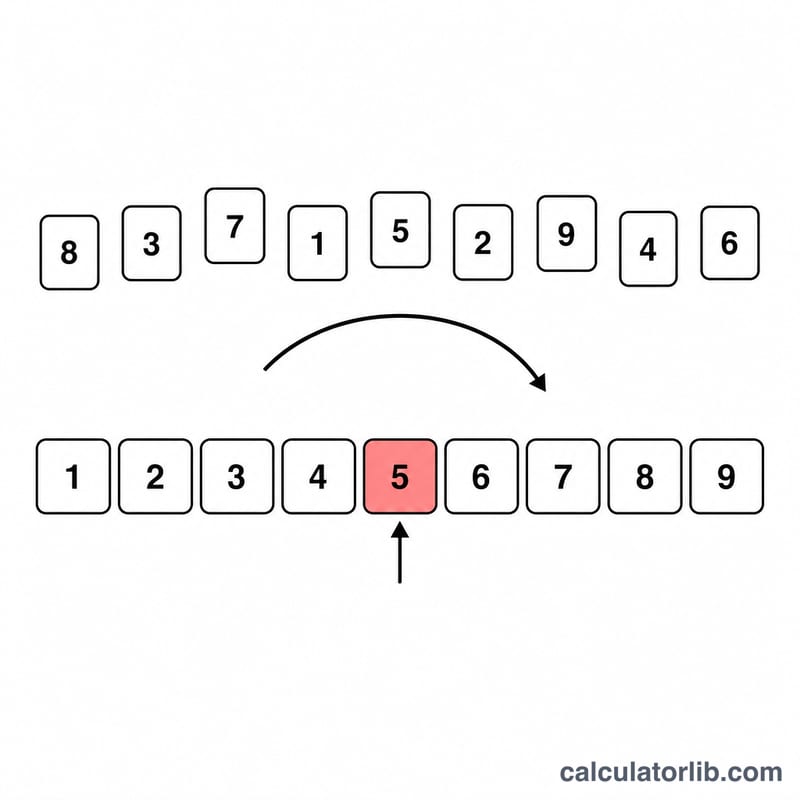
FAQ
What if there is no mode? When every number occurs the same number of times (e.g. all appear once), there is no mode and the calculator shows "No mode".
Can there be more than one mode? Yes. If two or more values tie for the highest frequency, the data is multimodal and all such values are listed.
Mean vs median — which should I use? The mean is sensitive to outliers, while the median better represents the "typical" value in skewed data such as incomes or house prices.


