What Is the Pass Percentage Calculator?
The Pass Percentage Calculator tells you what share of a group succeeded on an exam, course, or assessment. It is widely used by teachers, examiners, training providers, and school administrators to summarize results in a single, easy-to-understand figure. By converting raw counts into a percentage, you can compare classes, subjects, or years of different sizes on a fair, like-for-like basis.
How to Use It
Enter two numbers: the count of students who passed and the total number of students who sat the exam. The calculator divides the passed count by the total, multiplies by 100, and instantly returns the pass percentage. It also reports how many students failed and the corresponding fail percentage so you get a complete picture.
The Formula Explained
The core equation is simple:
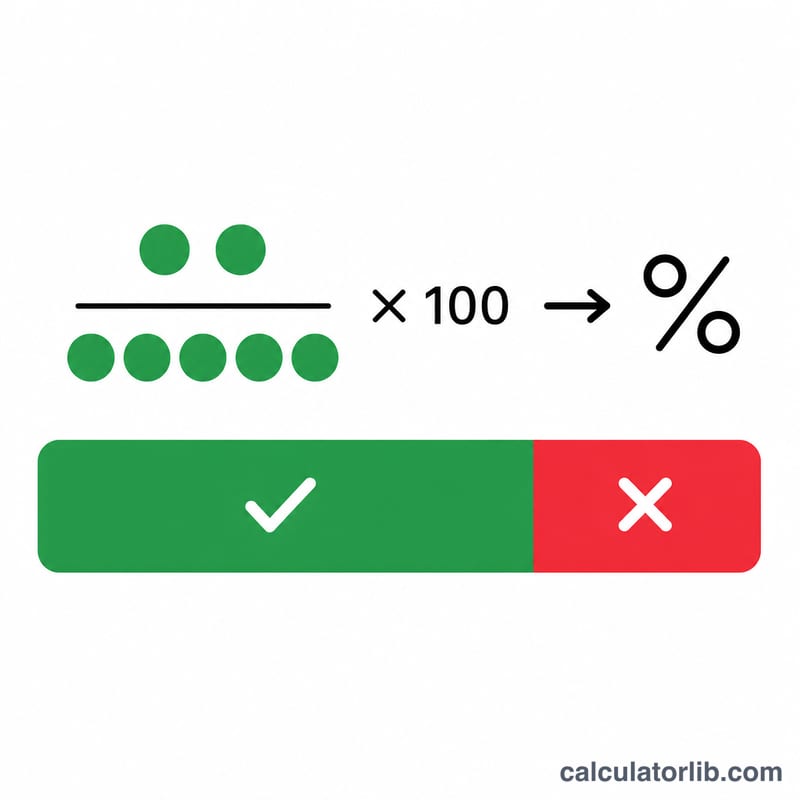
$$\text{Pass \%} = \frac{\text{Students Passed}}{\text{Total Students}} \times 100$$
The division gives a proportion between 0 and 1, and multiplying by 100 converts it to a percentage. The fail percentage is the complement: \(100 - \text{Pass\%}\). Make sure the total is greater than zero, otherwise the calculation is undefined.
Worked Example
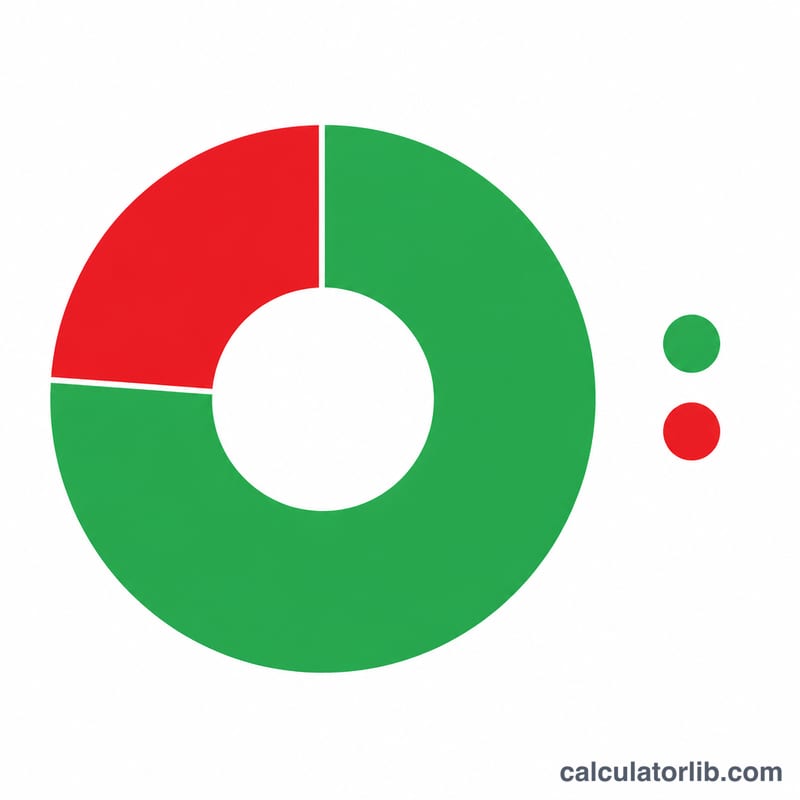
Suppose 85 out of 100 students passed an exam. $$\text{Pass\%} = (85 \div 100) \times 100 = 85\%$$ That leaves 15 students failing, a 15% fail rate. If instead 18 of 24 passed, $$\text{Pass\%} = (18 \div 24) \times 100 = 75\%$$ with 6 students (25%) failing.
Interpreting Your Pass Percentage
A pass percentage is a simple proportion: the share of a specific group of candidates who reached a defined pass mark. The calculator applies
$$\text{Pass \%} = \frac{ {\text{Students Passed}}}{ {\text{Total Students}}} \times 100$$Because it is a proportion, the number describes that one cohort on that one assessment. It is not a direct measure of exam difficulty, teaching quality, or student ability. A 95% pass rate can come from an easy paper, a strong intake, a low pass mark, or a cohort where weaker candidates were never entered — the single figure cannot distinguish between these causes.
Small cohorts move a lot
The sensitivity of the rate to one student is simply \(100/n\). In a class of 20, one student is worth 5 percentage points: 19 of 20 gives 95%, and one more failure drops it to 90%. In a cohort of 200, one student is worth only 0.5 points — 190 of 200 is 95%, and one extra failure gives 94.5%. So year-on-year swings in a small class are often noise, not a trend. Always quote the raw counts alongside the percentage (for example "19/20"), so readers can judge how much weight the figure carries.
The pass mark defines the number
A pass percentage is entirely conditional on the threshold used. Move the pass mark from 40 to 50 and the rate falls without a single script changing. Two rates are only comparable when both of these match:
- The same pass mark or grade boundary — a raw mark, a scaled score, a minimum grade (e.g. "grade C or above"), or a competency judgement. Pass marks differ between countries, awarding bodies and even between sittings when papers are statistically equated.
- The same eligibility rule for the denominator — everyone entered, everyone who sat the paper, or everyone who completed the course. These three denominators can produce visibly different rates from identical results.
Pass marks and cohort definitions are set by a national ministry, an awarding body or an institution; there is no universal standard, so never assume a pass rate from one system is comparable with one from another.
Absentees and withdrawals
Decide one rule and apply it to every group you compare. If 3 of 50 registered students did not sit the exam and 40 of the remaining 47 passed, you can report 40/47 = 85.1% (of those who sat) or 40/50 = 80.0% (of those registered). Both are defensible; mixing them across years or classes is not. State the rule in a footnote whenever you publish the figure.
What a pass rate is not
- Not an average score. Pass rate counts heads above a line; the mean measures how far above or below the line people sat. Two classes can both be at 80% pass while one averages 52 and the other 74. Report both where you can.
- Not a value-added or cohort-adjusted measure. Value-added and "progress" measures compare outcomes against what a similar intake would be expected to achieve. A raw pass rate makes no such adjustment, so it partly reflects who walked through the door.
- Not a per-student probability. An 80% class rate does not mean any given student has an 80% chance of passing.
The most useful way to read the result is as one line in a fuller picture: pass rate + fail rate + cohort size + pass mark + denominator rule + average score.
Key Terms and Definitions
| Term | Definition |
|---|---|
| Pass Percentage (pass rate) | The share of a cohort that met the pass standard, expressed per 100: \(\text{Pass \%} = (\text{passed} \div \text{total}) \times 100\). Example: 34 of 40 gives 85%. |
| Fail Percentage | The complement of the pass rate: \(100\% - \text{Pass \%}\), or equivalently \((\text{total} - \text{passed}) \div \text{total} \times 100\). With 34 of 40 passing, 6 failed and the fail rate is 15%. Pass % and fail % always sum to 100% provided every candidate in the denominator is classified as one or the other. |
| Students Passed | The numerator — the count of candidates who reached or exceeded the pass mark. It must be a subset of the denominator, so it can never exceed Total Students. Decide in advance how conditional passes, compensated passes, resits and pending appeals are counted. |
| Total Students (denominator / cohort size) | The count everything is measured against. Its definition is a choice: all students entered/registered, all who sat the assessment, or all who completed the course. Changing the definition changes the pass rate even when the results are identical. |
| Pass Mark / Grade Boundary | The threshold that separates a pass from a fail — a raw score (e.g. 40/100), a scaled score, a minimum grade, or a competency decision. Boundaries are set by the institution, awarding body or national authority, and may be adjusted between sittings so that papers of different difficulty demand the same standard. A pass rate is meaningless without knowing this threshold. |
| Cohort | The defined group being measured — one class, one subject entry, one exam sitting, one campus, or one academic year. Comparing pass rates is only fair when the cohorts are defined the same way and are broadly similar in composition. |
| Percentage vs. Percentage Point | A move from 80% to 84% is a rise of 4 percentage points, but a 5% relative increase (\(4 \div 80 = 0.05\)). Use "percentage points" for the arithmetic difference between two rates and "percent" for the relative change; swapping them is a common source of overstated claims. |
| Absentee / Withdrawal | An absentee is registered but does not sit the assessment; a withdrawal leaves the course or entry before it. Each must be either included in the denominator (usually counted as not passing) or excluded from it — consistently, across every group and year you compare. Report the rule alongside the figure. |
| Proportion vs. Percentage | A proportion is the same quantity on a 0–1 scale; a percentage is the proportion multiplied by 100. 34 of 40 is a proportion of 0.85 and a percentage of 85%. Statistical formulas (confidence intervals, significance tests) normally take the proportion, not the percentage. |
| Pass Rate vs. Average Score | The pass rate counts how many crossed a line; the average (mean) score measures the typical performance level. The pass rate ignores the size of a margin — a 39 and a 4 both count as one fail when the pass mark is 40. Reporting both gives a far more honest picture than either alone. |
| Cohort-adjusted / value-added measure | An outcome measure that compares actual results with what a statistically similar intake would be expected to achieve, so it reflects progress rather than raw attainment. A plain pass percentage contains no such adjustment. |
Which formula do you need?
The calculator gives one rate for one group. The choice that changes the answer most is how you combine groups, such as several classes, sittings or years.
- Pooled rate (recommended): add up all students who passed, add up all students entered, then divide once. Each student counts equally, whatever the size of their class.
- Average of class percentages: this treats a class of 10 and a class of 50 as equal weights. It is only appropriate when you want to compare classes as units, not describe the whole cohort.
Example: Class A has 9 of 10 passing (90%) and Class B has 30 of 50 passing (60%). The pooled rate uses the combined counts:
$$\text{Pass \%} = \frac{9 + 30}{10 + 50} \times 100 = \frac{39}{60} \times 100 = 65\%$$The pooled pass percentage is 65%. Averaging the two class figures instead gives \((90 + 60) / 2 = 75\%\), which overstates the result because the small, high-scoring class is given the same weight as the large one.
The same logic applies to the denominator. Decide once whether "Total Students" means everyone enrolled or only those who sat the paper, and use that definition for every group you compare. Switching definitions between years makes the percentages incomparable even when the counts are accurate. State the choice next to the figure, for example "39 of 60 entered".
Conventions and edge cases
Each case below was run through this calculator; the result column is what it actually returns.
| Case | Input | Result |
|---|---|---|
| More than the total (120 of 100) | 120, 100 | The number passed cannot be negative or more than the total. |
| 85 of 100 | 85, 100 | 85% |
| 0 of 0 | 0, 0 | The pass percentage is not defined when the total is 0. |
Checked on 2026-11-08
FAQ
Can the pass percentage exceed 100%? No. Since passed students can never exceed the total, the result is always between 0% and 100%.
What if no one passed? The pass percentage is 0% and the fail percentage is 100%.
Does it work for any group size? Yes — it works for any total greater than zero, from a small class to a national cohort.