
What Is the PEG Ratio?
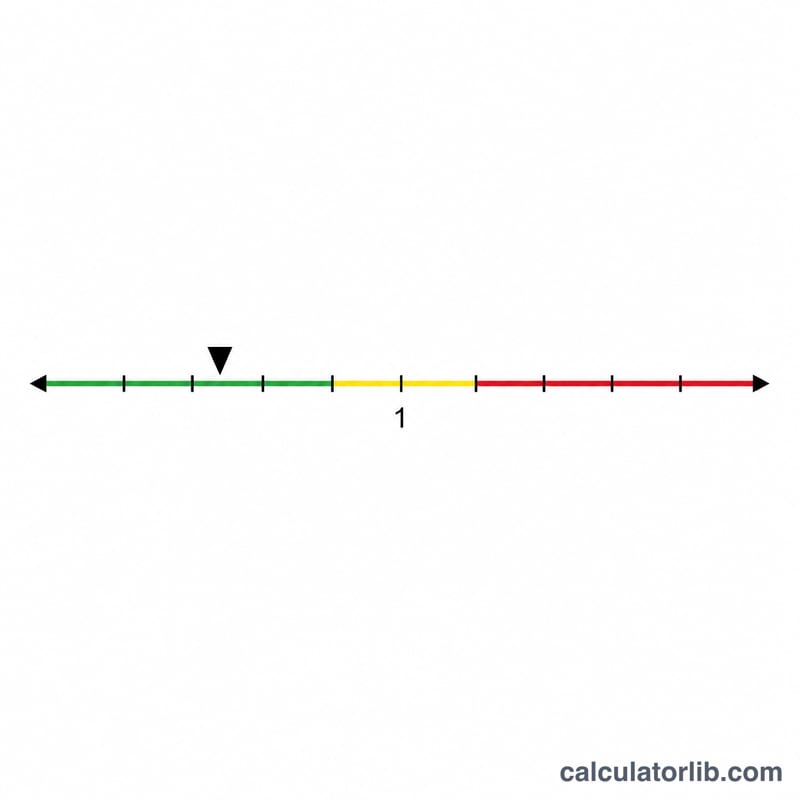
The Price/Earnings-to-Growth (PEG) ratio refines the popular P/E ratio by factoring in how fast a company's earnings are growing. A stock with a high P/E might still be a bargain if its earnings are rising quickly, and the PEG ratio captures that trade-off in a single number. It was popularized by investors such as Peter Lynch, who suggested that a fairly valued company should have a PEG of around 1.
How to Use This Calculator
Enter the stock's P/E ratio (share price divided by earnings per share) and its expected annual EPS growth rate expressed as a percentage. The calculator divides the P/E by the growth rate to return the PEG ratio. As a rough guide: a PEG below 1 may indicate an undervalued stock relative to its growth, around 1 suggests fair value, and well above 1 may indicate overvaluation.
The Formula Explained
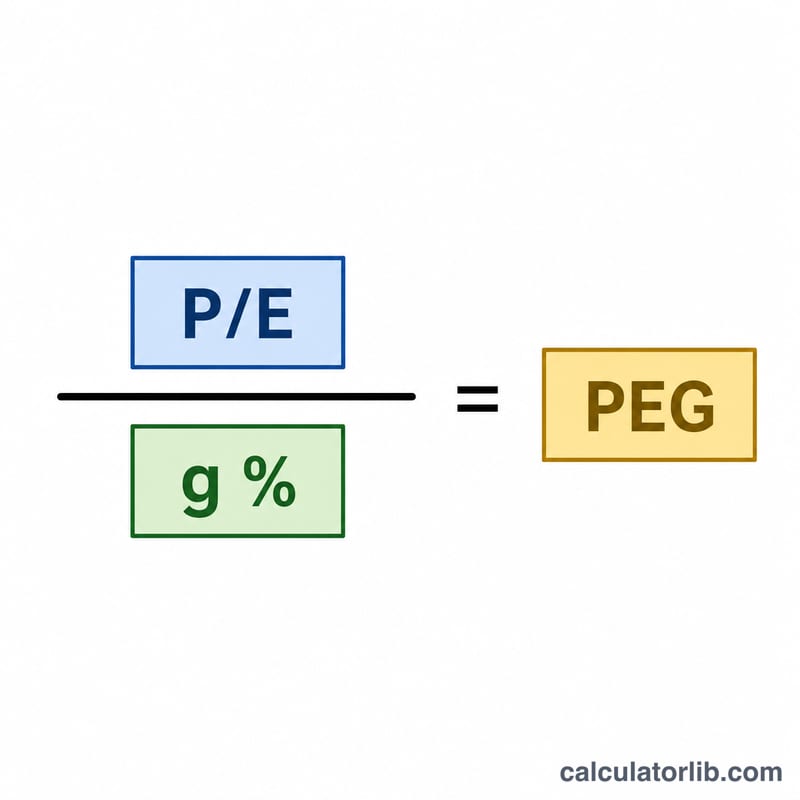
The equation is simply $$\text{PEG} = \frac{\text{P/E Ratio}}{\text{EPS Growth Rate (\%)}}$$ Note that the growth rate is used as a whole number percentage (for example, enter 15 for 15%), not as a decimal. This is the standard convention so that a P/E of 15 and 15% growth yields a tidy PEG of 1.0.
Worked Example
Suppose a company trades at a P/E ratio of 25 and analysts expect annual EPS growth of 20%. The PEG ratio is $$25 \div 20 = 1.25$$ Because this is above 1, the stock looks slightly expensive relative to its growth rate, though many high-quality growth companies trade above 1.
FAQ
What is a good PEG ratio? A PEG near or below 1.0 is traditionally considered attractive, but acceptable values vary by industry and market conditions.
Should I use trailing or forward figures? A forward PEG uses projected growth and is more common for valuing growth stocks; a trailing PEG uses historical growth. Be consistent with your P/E and growth inputs.
Why can the PEG be misleading? It relies on growth forecasts, which can be inaccurate, and it breaks down for companies with negative or zero earnings growth.