
What is the Player Efficiency Rating Calculator?
This calculator produces a simplified Player Efficiency Rating (PER) for a basketball player using a single game or season box score. Inspired by John Hollinger's per-minute PER concept, it builds a composite of everything a player does well — points, rebounds, assists, steals and blocks — and subtracts the things that hurt the team: missed shots, turnovers and fouls. The net total is divided by minutes played and scaled to 36 minutes so you can compare players who logged different amounts of court time on an even footing.
How to use it
Enter the player's minutes played and the raw box-score totals: points, rebounds, assists, steals, blocks, field goals missed, free throws missed, turnovers and personal fouls. Click calculate to see the per-36-minute efficiency rating plus a breakdown of positive versus negative contributions. A higher number means more production per minute. League-average starters typically land in the low-to-mid range, while elite scorers and all-around players push much higher.
The formula explained
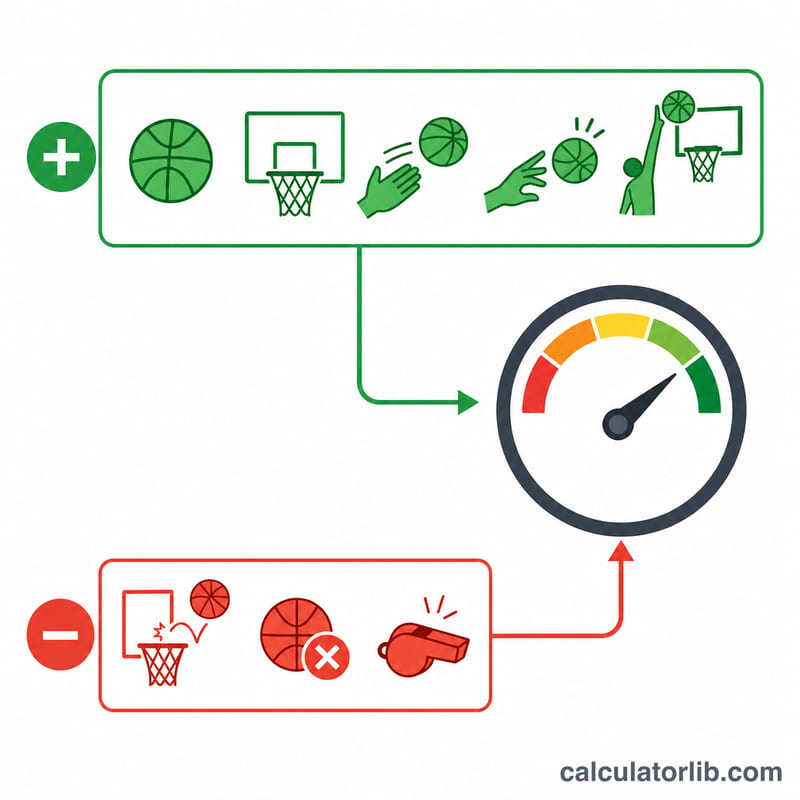
The positive side rewards scoring and playmaking one-for-one and gives steals and blocks a 1.5 weight because they are scarce, high-impact defensive plays. The negative side counts each missed field goal, missed free throw and turnover as a full point and personal fouls at half weight. The difference is the net composite. Dividing by minutes converts it to a rate stat; multiplying by 36 expresses it as a typical-starter workload.
$$\text{PER} = \frac{36}{\text{Min}} \times \left( \text{Positive} - \text{Negative} \right)$$
$$\begin{gathered} \text{PER} = \frac{36}{\text{Min}} \times \left( \text{Positive} - \text{Negative} \right) \\[1.5em] \text{where}\quad \left\{ \begin{aligned} \text{Positive} &= \text{Pts} + \text{Reb} + \text{Ast} + 1.5\,\text{Stl} + 1.5\,\text{Blk} \\ \text{Negative} &= \text{FG Miss} + \text{FT Miss} + \text{TO} + 0.5\,\text{Fouls} \end{aligned} \right. \end{gathered}$$
Worked example
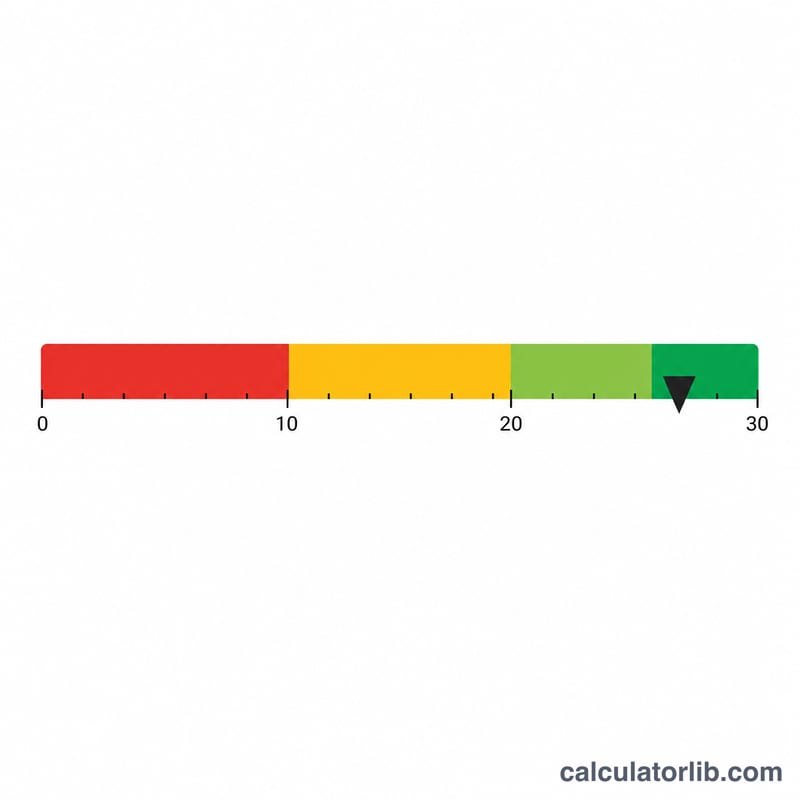
A player logs 36 minutes with 20 points, 8 rebounds, 5 assists, 2 steals, 1 block, 8 missed field goals, 2 missed free throws, 3 turnovers and 2 fouls. Positive \(= 20 + 8 + 5 + 1.5(2) + 1.5(1) = 37.5\). Negative \(= 8 + 2 + 3 + 0.5(2) = 14\). Net composite \(= 23.5\). Per minute \(= 23.5 / 36 = 0.6528\), and \(\times 36\) returns a PER₃₆ of 23.5.
FAQ
Is this the official NBA PER? No. Hollinger's official PER uses pace and league adjustments. This is a transparent, simplified per-minute approximation good for quick comparisons.
Why scale to 36 minutes? It normalizes for playing time so a bench player and a starter can be compared on production rate, not just totals.
Can it be negative? Yes — if a player misses many shots and commits turnovers without producing, the composite can fall below zero.