
What this calculator does
The Sales Growth Rate Forecast Calculator projects future sales by applying a single, constant annual growth rate to a starting (base-year) sales figure. It uses compound growth, so each year builds on the previous year's projected total, and it returns a complete year-by-year forecast table. Because it is pure compound-growth math, it works for any currency, product, or region — there is no country-specific assumption.
How to use it
Enter the initial year (optional — used only to label the table rows), the sales of that initial year, the expected growth rate in percent per year, and how many forecast years you want to project. The tool returns each year's projected sales, the constant year-over-year growth, the final-year total, and the average annual growth rate (CAGR).
The formula explained
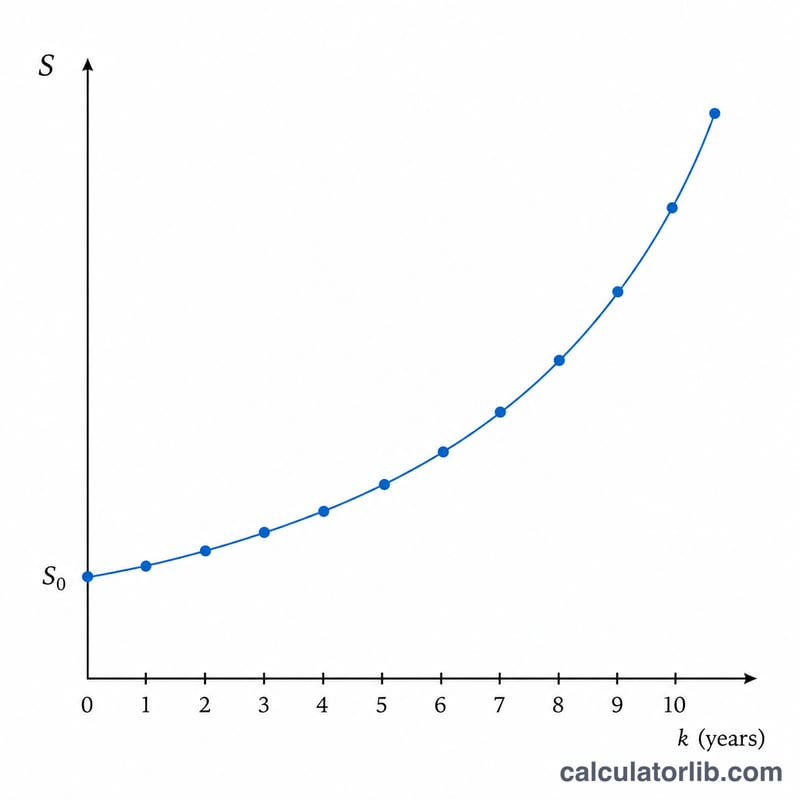
First the percentage is converted to a fraction: \(r = \text{growthRate} / 100\). Then for each year \(k\) (0, 1, 2, ...), projected sales are $$S_k = S_0 \times (1 + r)^k,$$ where \(S_0\) is the initial-year sales. The final-year total is simply \(S_0 \times (1 + r)^n\) for \(n\) forecast years. The CAGR is the geometric mean: $$\left(\left(\frac{S_n}{S_0}\right)^{1/n} - 1\right) \times 100,$$ which for a constant-rate projection equals the input growth rate.
Worked example
With initial sales 1000, growth rate 12%/year, and 10 forecast years: \(r = 0.12\). Year 1 $$= 1000 \times 1.12 = 1120.00,$$ Year 2 \(= 1254.40\), and so on. The final year (\(k = 10\)) $$= 1000 \times 1.12^{10} = 3105.85.$$ CAGR $$= \left(\left(\frac{3105.85}{1000}\right)^{1/10} - 1\right) \times 100 = 12.00\%/\text{year},$$ matching the input rate.
FAQ
Can the growth rate be negative? Yes — enter a negative percent to model declining sales. The rate must stay above -100% or the model breaks (multiplier of zero or less).
Why does CAGR equal my input rate? When you apply one constant rate every year, the geometric average is identical to that rate. CAGR differs from the input only when actual year-by-year sales vary.
Does the initial year affect the math? No. It only labels the rows; the projection depends solely on initial sales, growth rate, and forecast years.