
What this calculator does
This tool computes the six most-used per-share valuation metrics for a listed company: EPS, BPS, PER, PBR, forecast dividend yield and forecast dividend payout ratio. The math is universal and applies to any company in any market, as long as you keep all monetary figures and the stock price in a single consistent currency. The ratios PER, PBR, yield and payout are dimensionless or percentages, so they are independent of the currency you choose.
How to use it
Enter the company's forecast net income and net assets in millions, its shares outstanding in ten-thousands, the forecast dividend per share, and the current stock price. The calculator scales the aggregate figures (net income and net assets are multiplied by 1,000,000; shares by 10,000) and then derives each indicator.
The formulas explained
\(\text{EPS} = \text{Net Income} / \text{Shares}\) shows the profit attributable to each share. \(\text{BPS} = \text{Net Assets} / \text{Shares}\) is the book (accounting) value per share. \(\text{PER} = \text{Price} / \text{EPS}\) tells you how many years of earnings the price represents. \(\text{PBR} = \text{Price} / \text{BPS}\) compares price to book value. Dividend yield \(= \text{Dividend} / \text{Price} \times 100\) is the cash return at the current price, and the payout ratio \(= \text{Dividend} / \text{EPS} \times 100\) shows what fraction of earnings is paid out.
$$\text{EPS} = \dfrac{\text{Net Income}\times 10^{6}}{\text{Shares}\times 10^{4}} \qquad \text{BPS} = \dfrac{\text{Net Assets}\times 10^{6}}{\text{Shares}\times 10^{4}}$$$$\text{PER} = \dfrac{\text{Price}}{\text{EPS}} \qquad \text{PBR} = \dfrac{\text{Price}}{\text{BPS}}$$$$\text{Yield} = \dfrac{\text{Dividend}}{\text{Price}}\times 100\% \qquad \text{Payout} = \dfrac{\text{Dividend}}{\text{EPS}}\times 100\%$$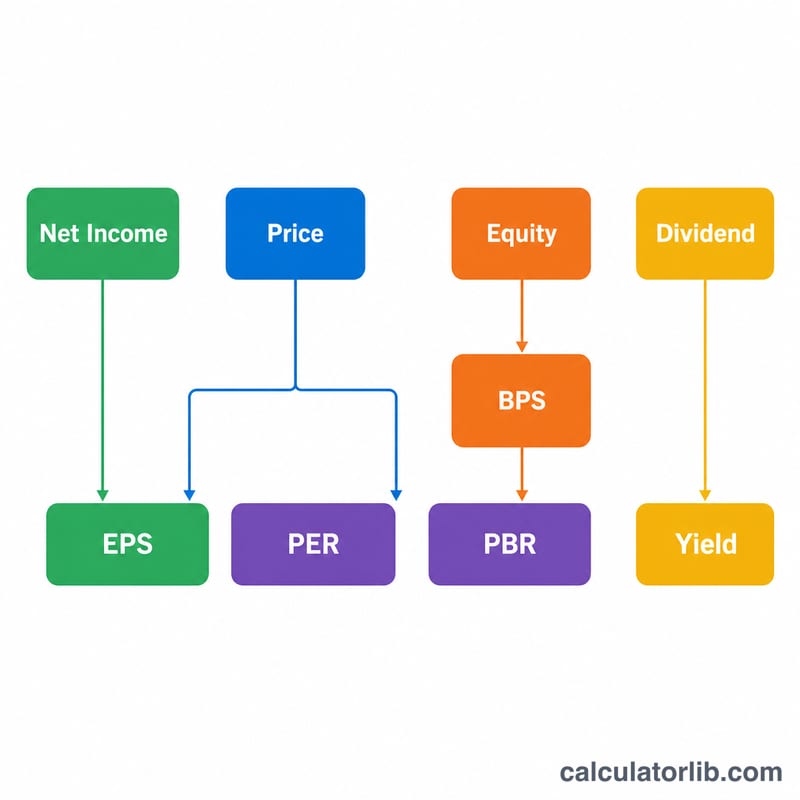
Worked example
With net income 13,500 million, net assets 169,006 million, 27,902 (ten-thousand) shares, dividend 20 and price 1,137: shares = 279,020,000.
$$\text{EPS} = \dfrac{13{,}500{,}000{,}000}{279{,}020{,}000} = 48.38$$$$\text{BPS} = 605.71$$$$\text{PER} = \dfrac{1137}{48.38} = 23.50\times$$$$\text{PBR} = \dfrac{1137}{605.71} = 1.88\times$$$$\text{Yield} = \dfrac{20}{1137} \times 100 = 1.76\%$$$$\text{Payout} = \dfrac{20}{48.38} \times 100 = 41.34\%$$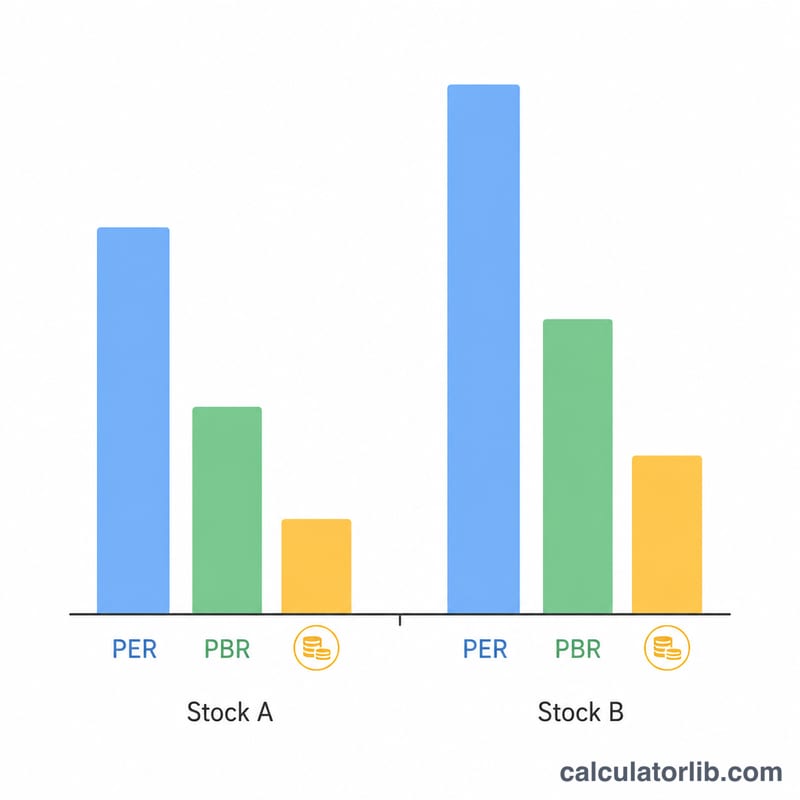
FAQ
Why might PER or EPS be negative? If the company forecasts a loss, net income is negative and EPS goes negative, which makes PER and the payout ratio meaningless — the tool reports them honestly rather than hiding them.
What if shares or price is zero? Division by zero is guarded; the affected metric returns blank/zero so the result stays well defined.
Is this investment advice? No. PER, PBR and dividend yield are commonly used to gauge whether a stock looks relatively cheap, but the results here are informational only.