

What This Calculator Does
This tool applies to US 401(k) plans, where traditional contributions are made with pre-tax dollars. Because the money you set aside is deducted before income tax is calculated, your take-home pay falls by less than the amount you contribute. This calculator shows the real per-paycheck impact so you can decide how much to save without surprises. Assumptions: a traditional (pre-tax) 401(k), a single flat marginal tax rate covering federal/state/local income tax, and FICA handled separately.
How to Use It
Enter your gross pay per paycheck, the percentage you want to contribute, and your marginal tax rate (the rate on your top dollar of income). The result shows how much smaller your actual paycheck becomes, plus the tax you save and a side-by-side of net pay with and without contributing.
The Formula Explained
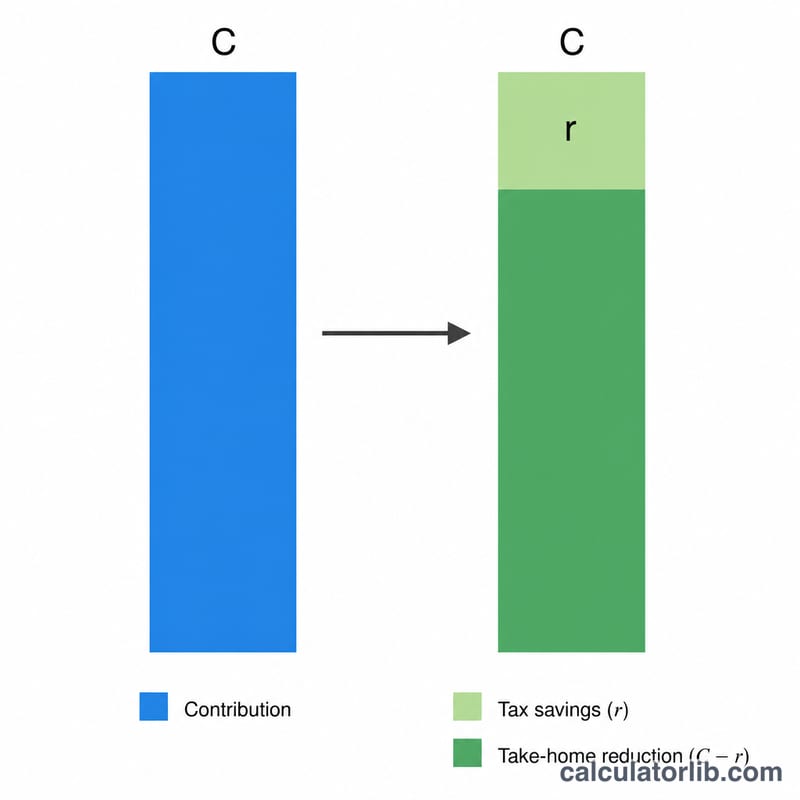
If you contribute C dollars at a marginal tax rate r, you also avoid paying \(C \times r\) in income tax. So your net paycheck only drops by:
$$\text{Take-home reduction} = C \times (1 - r)$$
Net pay with the contribution is gross minus C, with tax applied only to the smaller taxable base: $$G - C - (G - C)\,r$$
Worked Example
Suppose gross pay is $2,000, you contribute 6% ($120), and your marginal rate is 22% (0.22). Take-home reduction $$= 120 \times (1 - 0.22) = \$93.60$$ You set aside $120 for retirement but your paycheck only drops $93.60 — the other $26.40 is tax you didn't pay.
2024 IRS 401(k) Contribution Limits
The IRS sets annual caps on how much you can defer into a 401(k). The limits below apply to the 2024 tax year (and several were unchanged for context). Pre-tax (traditional) contributions reduce your taxable income up to these elective deferral limits, which is what drives the paycheck tax savings this calculator estimates.
| Limit | 2024 Amount | Notes |
|---|---|---|
| Employee elective deferral limit | $23,000 | Maximum you can contribute from your own pay (traditional + Roth combined), under age 50 |
| Catch-up contribution (age 50+) | +$7,500 | Additional amount allowed if you are 50 or older during the year |
| Effective limit, age 50+ | $30,500 | $23,000 deferral + $7,500 catch-up |
| Total combined limit (employee + employer) | $69,000 | All sources: your deferrals, employer match, profit sharing. Excludes catch-up |
| Total combined limit, age 50+ | $76,500 | $69,000 + $7,500 catch-up |
These figures cover the elective deferral side that creates per-paycheck tax savings. Employer matching contributions count toward the combined $69,000 cap but do not reduce your own take-home pay. To project how these annual contributions grow over time, see a 401(k) Retirement Calculator.
Paycheck Impact Across Contribution Rates
Each pre-tax dollar you contribute lowers your taxable income, so your take-home pay falls by less than the contribution amount. The drop equals the contribution times \((1 - \text{marginal rate})\). The table below uses a fixed gross paycheck of $3,000 and shows the contribution, the tax saved, and the actual reduction in take-home pay at three common federal marginal rates.
| Contribution % | Contribution ($) | Marginal Rate | Tax Saved | Take-Home Reduction |
|---|---|---|---|---|
| 3% | $90.00 | 12% | $10.80 | $79.20 |
| 3% | $90.00 | 22% | $19.80 | $70.20 |
| 6% | $180.00 | 12% | $21.60 | $158.40 |
| 6% | $180.00 | 22% | $39.60 | $140.40 |
| 6% | $180.00 | 24% | $43.20 | $136.80 |
| 10% | $300.00 | 22% | $66.00 | $234.00 |
| 10% | $300.00 | 24% | $72.00 | $228.00 |
| 15% | $450.00 | 22% | $99.00 | $351.00 |
| 15% | $450.00 | 24% | $108.00 | $342.00 |
Notice that at a 22% marginal rate, contributing $180 only reduces your paycheck by $140.40 — the government effectively covers $39.60 through reduced withholding. The higher your marginal rate, the cheaper each contributed dollar feels today. To see how the resulting net pay fits your full budget, try a Take-Home Paycheck Calculator.
Key Terms Explained
- Gross pay
- Your total earnings for a pay period before any taxes, deductions, or contributions are subtracted. It is the starting point for calculating both contributions and net pay.
- Marginal tax rate
- The percentage of tax applied to your next dollar of income — the rate of your top tax bracket. Because pre-tax 401(k) contributions come off the top of your income, your tax savings are based on this marginal rate, not your lower average (effective) rate.
- Pre-tax (traditional) contribution
- Money sent to a traditional 401(k) before income tax is withheld. It lowers your current taxable income; you pay ordinary income tax later when you withdraw in retirement.
- Take-home (net) pay
- The amount actually deposited in your bank account after taxes, FICA, and deductions. A pre-tax 401(k) contribution reduces take-home pay by less than the contribution amount because of the tax savings.
- Tax savings
- The reduction in income tax withheld because a pre-tax contribution shrinks your taxable income. It equals the contribution multiplied by your marginal tax rate.
- FICA
- Federal Insurance Contributions Act taxes — Social Security (6.2%) and Medicare (1.45%) — totaling 7.65% for employees. Important: traditional 401(k) contributions are not exempt from FICA, so those taxes still apply to the full gross pay.
- Elective deferral
- The portion of your salary you choose to contribute to your 401(k). The IRS caps annual elective deferrals ($23,000 in 2024, plus a $7,500 catch-up if age 50+).
FAQ
Does this work for a Roth 401(k)? No. Roth contributions are made after tax, so your paycheck drops by the full contribution amount and there is no immediate tax saving.
What marginal rate should I use? Use the tax bracket on your highest dollar of income; you can add your state income tax rate for a fuller picture.
Does it include Social Security and Medicare? No. FICA taxes still apply to traditional 401(k) contributions, so this model focuses only on income-tax effects.