What Is the Revenue CAGR Calculator?
The Compound Annual Growth Rate (CAGR) measures the smoothed, year-over-year growth rate of a value as if it grew at a steady pace each year. It is widely used to express how fast revenue, profit, an investment, or any metric has grown over multiple years. Because real-world growth is rarely steady, CAGR gives a single, comparable figure that strips out the volatility between years.
How to Use It
Enter three numbers: the beginning value at the start of the period, the ending value at the end, and the number of years between them. The calculator returns the annual compound growth rate as a percentage, plus the total cumulative growth and the raw change in value.
The Formula Explained
CAGR is computed as \(\left(\frac{\text{End}}{\text{Begin}}\right)^{1/n} - 1\). The ratio End/Begin captures total growth; raising it to the power 1/n (where n is the number of years) finds the equivalent constant annual rate; subtracting 1 converts it back into a growth rate. Multiplying by 100 expresses it as a percentage.
$$\text{CAGR} = \left(\frac{\text{End}}{\text{Begin}}\right)^{1/n} - 1$$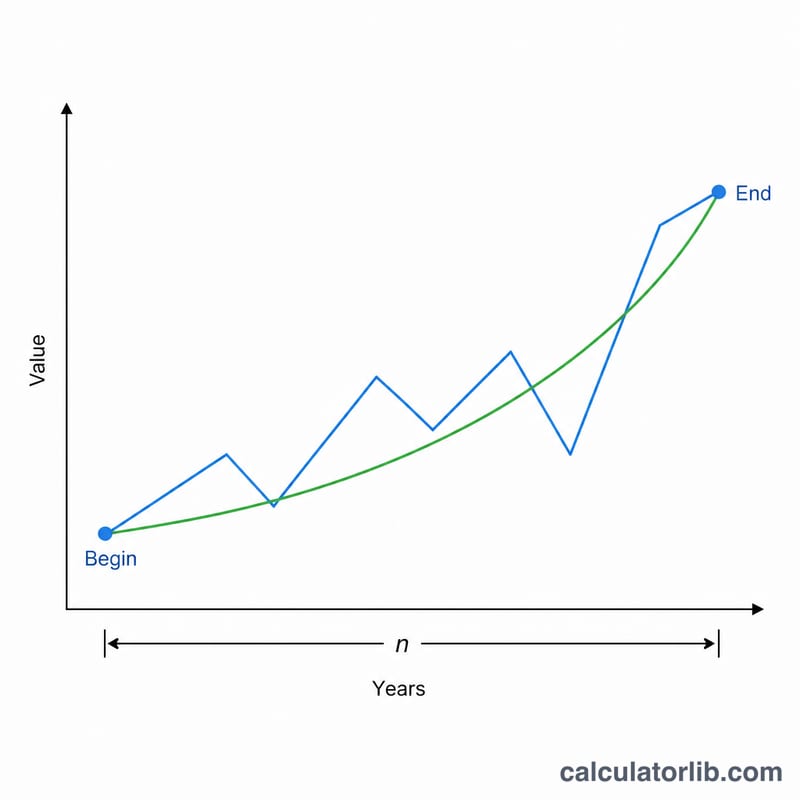
Worked Example
Suppose revenue grows from $100,000 to $250,000 over 5 years. The ratio is \(250{,}000 / 100{,}000 = 2.5\). Raising to the power 1/5 gives \(2.5^{0.2} \approx 1.20112\), so CAGR \(\approx 0.20112\), or about 20.11% per year. Total cumulative growth is 150%, and the value changed by $150,000.
$$\text{CAGR} = \left(\frac{250{,}000}{100{,}000}\right)^{1/5} - 1 \approx 0.20112 \approx 20.11\%$$
FAQ
Does CAGR account for in-between fluctuations? No. CAGR only uses the starting and ending values, so it smooths over any peaks or dips during the period.
What if my ending value is lower than the beginning? CAGR will be negative, indicating an average annual decline.
How is CAGR different from average annual growth? A simple average of yearly percentages can overstate growth; CAGR reflects compounding and is generally the more accurate measure of growth over time.