What this calculator does
This tool takes an ordered series of yearly values (revenue, users, sales, or any metric) and computes two things: the year-over-year (YoY) growth rate between each consecutive pair of years, and the compound annual growth rate (CAGR) from the first year to the last. The math is universal — it works in any currency or unit because it relies only on ratios.
How to use it
Enter at least two numeric values, in chronological order, separated by commas or new lines (for example 100, 120, 150, 180). The number of elapsed periods is the count of values minus one. Optionally pick how many significant digits to show. Press calculate to see each YoY rate and the single smoothed CAGR.
The formula explained
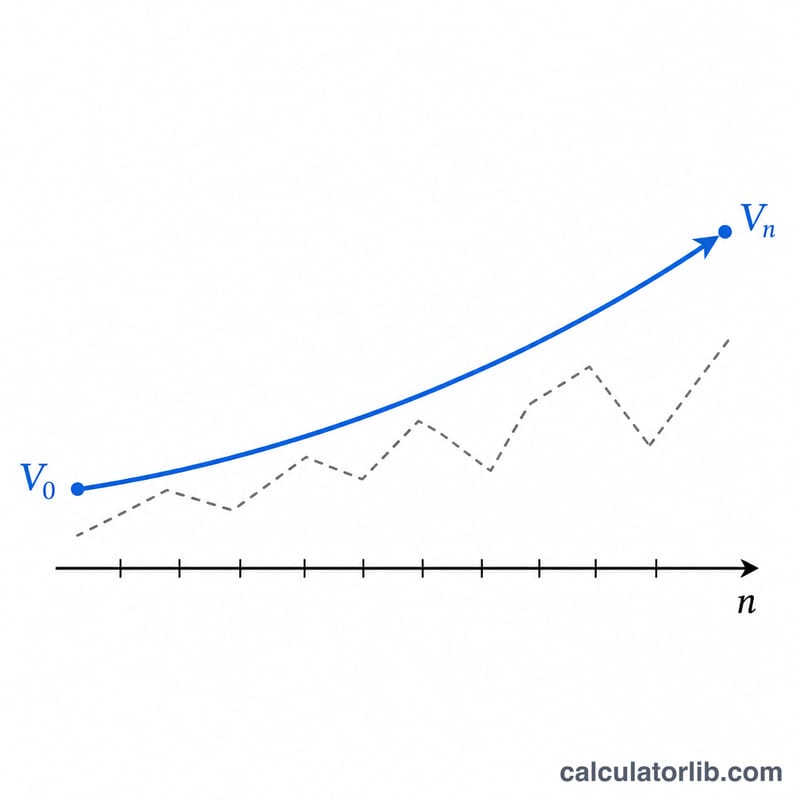
The year-over-year rate for period i is \(g_i = V_i / V_{i-1} - 1\). The CAGR is \((V_n / V_0)^{1/n} - 1\), where \(n\) is the number of elapsed years. CAGR is the single constant rate that, compounded each year, grows the first value into the last value. It usually differs from the simple average of the yearly rates because compounding is multiplicative.
Worked example
For the series 100, 120, 150, 180 over 4 years (n = 3 periods): YoY rates are 20%, 25%, and 20%. $$\text{CAGR} = (180/100)^{1/3} - 1 = 1.8^{0.3333} - 1 = 0.21644$$ or about 21.64% per year. Check: \(100 \times 1.21644^3 = 180\).
Interpreting Your CAGR Result
CAGR answers a single question: at what constant annual rate would the base value have to grow, compounding each period, to arrive exactly at the end value? Read the sign first:
- Positive CAGR — the end value exceeds the start value; the series grew on net over the span.
- Zero CAGR — the end value equals the start value; there was no net change across the period, regardless of any movement in between.
- Negative CAGR — the end value is below the start value; the series declined on net.
CAGR smooths out volatility. Because the formula uses only the first and last values, it treats the series as if it grew at one steady rate every year. A series that surged, crashed, and recovered can show the same CAGR as one that crept up gently. This is useful for summarizing long-run performance, but it deliberately hides the year-to-year swings, drawdowns, and the timing of gains.
Pair CAGR with year-over-year (YoY) rates. The per-period growth rates reveal the volatility that CAGR conceals — which years drove the result, whether growth is accelerating or fading, and how bumpy the path was. Looking at CAGR alongside the YoY series gives both the headline rate and the texture behind it.
Finally, CAGR is a descriptive measure of what already happened, not a forecast. A historical CAGR does not guarantee future growth will continue at that rate. This section is general educational information, not investment advice.
Definitions & Glossary
- CAGR (compound annual growth rate)
- The constant annual rate that, compounded over the elapsed periods, turns the base value into the end value: \(\left(V_n / V_0\right)^{1/n} - 1\).
- Year-over-year (YoY) growth
- The percentage change from one period to the next, \(\left(V_t - V_{t-1}\right)/V_{t-1}\). Unlike CAGR, it varies from year to year and exposes volatility.
- Period / elapsed periods (\(n\))
- The number of growth intervals between values. For a series of yearly figures, \(n\) equals the count of values minus one — e.g. six annual data points span five periods.
- Base value (\(V_0\))
- The first (earliest) value in the series, used as the denominator in the CAGR ratio.
- End value (\(V_n\))
- The last (most recent) value in the series, used as the numerator in the CAGR ratio.
- Compounding
- The process by which each period's growth is applied on top of the accumulated value, so gains build on prior gains rather than on the original base alone.
- Smoothed rate
- A single representative annual rate (CAGR) that replaces an irregular series of YoY rates with one even rate producing the same endpoints.
FAQ
Why is CAGR not the average of the yearly rates? Because growth compounds. Averaging 20%, 25%, 20% gives 21.67%, close but not equal to the true 21.64% CAGR.
Can CAGR be negative? Yes. If the last value is below the first, CAGR is negative, indicating an average annual decline.
What if a value is zero or the series changes sign? A zero base makes a YoY rate undefined, and a sign change between the first and last value makes a real-valued CAGR undefined; the calculator flags these instead of returning a misleading number.