What Is GMROI?
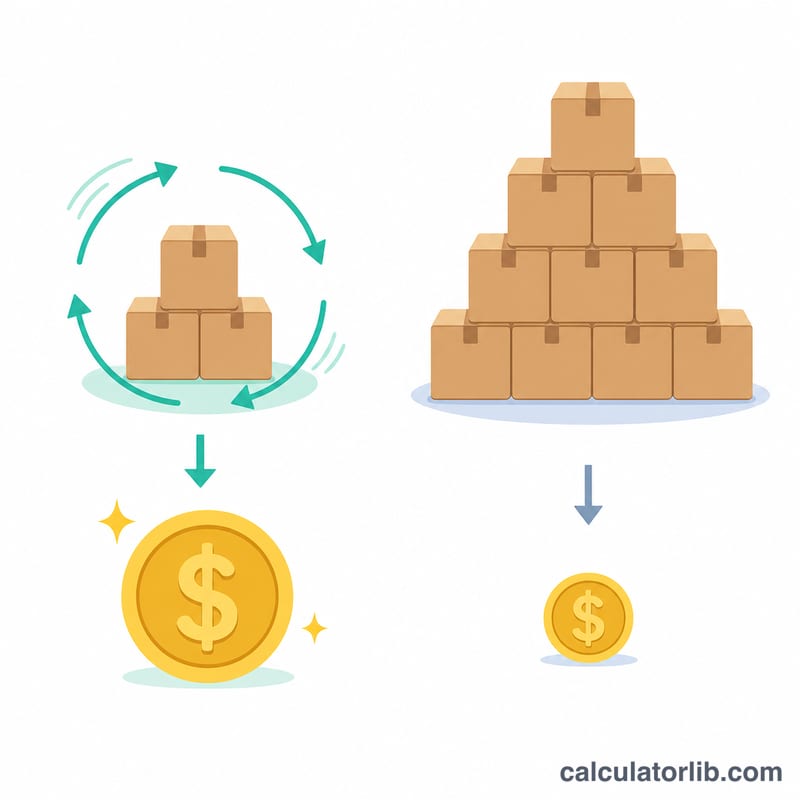
GMROI (Gross Margin Return on Investment) is a retail and inventory-management metric that tells you how many gross-margin dollars you earn for every dollar invested in inventory. It links profitability with inventory efficiency, making it one of the most useful key performance indicators for buyers, category managers, and store owners. A GMROI above 1.0 means the inventory generates more gross margin than it costs to hold; below 1.0 means it is losing money on a margin basis.
How to Use This Calculator
Enter two figures: your total gross margin in dollars (net sales minus cost of goods sold) and your average inventory cost (the average value of inventory at cost over the period). The calculator divides the first by the second to return your GMROI ratio, and also shows it as a percentage. Use the same time period for both inputs — typically a year, quarter, or month.
The Formula Explained
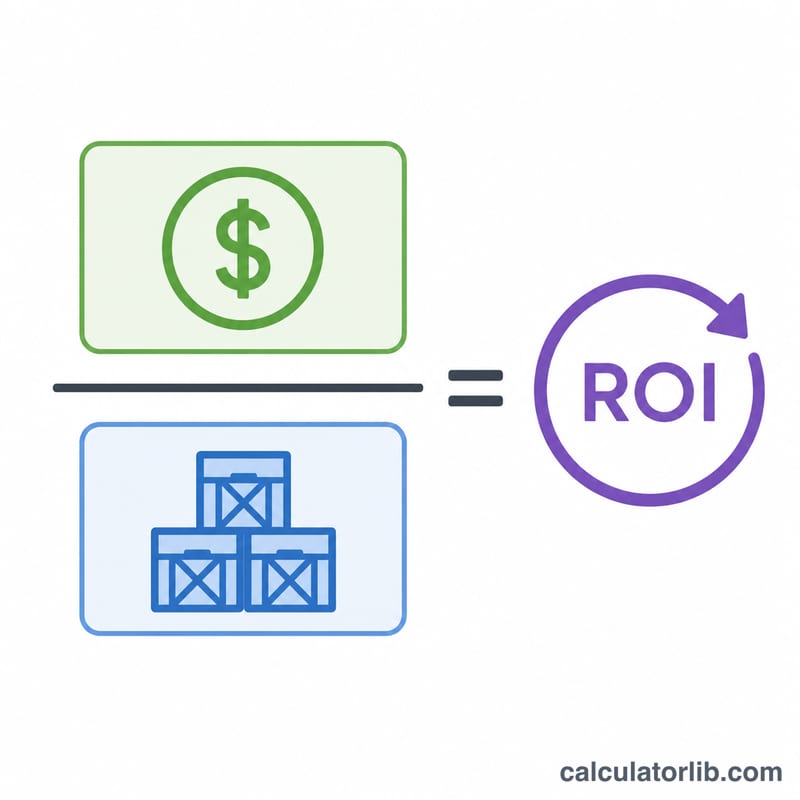
$$\text{GMROI} = \frac{\text{Gross Margin (\$)}}{\text{Avg Inventory Cost (\$)}}$$ The numerator is the profit you keep after the cost of goods sold; the denominator is the capital tied up in stock. Because it uses inventory at cost (not retail), GMROI cleanly measures the return your inventory investment produces.
Worked Example
Suppose a department generates $120,000 in gross margin and carries an average inventory cost of $60,000. $$\text{GMROI} = 120{,}000 \div 60{,}000 = \mathbf{2.0}$$ or 200%. That means every \(\$1\) invested in inventory returns $2.00 in gross margin — a healthy result for most retail categories.
Interpreting Your GMROI Result
GMROI (Gross Margin Return on Investment) shows how many dollars of gross margin an inventory investment produced for each dollar of inventory held at cost. For example, gross margin of $150,000 on average inventory of $50,000 gives \(\frac{150{,}000}{50{,}000} = \)3.0, meaning each inventory dollar returned $3.00 in gross margin.
General reading of the result
- Below 1.0: the inventory generated less gross margin than it cost to stock. This usually signals slow-moving, overstocked, or heavily discounted merchandise.
- Around 1.0: gross margin just equals the inventory investment. This is a break-even point on gross margin only, and it ignores operating costs (labor, rent, utilities) and carrying costs (storage, insurance, shrink, financing, obsolescence). A business at 1.0 is typically not profitable overall.
- 2.0 to 3.0: often described as a healthy, productive range for many retailers, with margin comfortably above the inventory investment.
- Above 3.0: generally signals strong inventory productivity, from fast turns, high margins, or both. Very high values can also reflect lean stock levels that risk stockouts, so context matters.
How GMROI relates to margin and turnover
GMROI combines profitability and speed of sales:
$$\text{GMROI} = \text{Gross margin \%} \times \frac{ \text{Net sales}}{ \text{Average inventory at cost}}$$
This works because \(\frac{\text{Gross margin}}{\text{Net sales}} \times \frac{\text{Net sales}}{\text{Average inventory}} = \frac{\text{Gross margin}}{\text{Average inventory}}\). A retailer can reach the same GMROI with a high margin and slow turnover (such as jewelry) or a low margin and fast turnover (such as groceries).
Benchmarks vary by industry, product category, business model, and time period, so a GMROI is most informative when compared with the same business over time or with close peers in the same category.
Typical GMROI Ranges by Retail Sector
The ranges below are approximate, commonly cited rules of thumb, not precise statistics. They differ by source, period, region, and company, and they are not guarantees or targets for any particular business.
| Retail type | Approximate commonly cited GMROI | Typical driver |
|---|---|---|
| Grocery / supermarkets | about 2.0 to 4.0 | Lower margins offset by fast inventory turnover |
| General merchandise / mass retail | about 1.5 to 3.0 | Moderate margins and moderate turnover |
| Apparel | about 1.5 to 3.0 | Higher margins but seasonal markdown risk |
| Hardware / home improvement | about 1.5 to 2.5 | Broad assortment with moderate turnover |
| Specialty / jewelry | about 1.0 to 2.0 | High margins but slow turnover |
Within one store, categories can differ widely, so GMROI is often tracked by department, category, or supplier rather than only for the whole business.
Key Terms in GMROI
- Net sales
- Revenue from sales after subtracting returns, allowances, and discounts.
- Cost of goods sold (COGS)
- The direct cost of the merchandise sold during the period, including purchase cost and typically freight-in.
- Gross margin dollars
- Net sales minus COGS. It is the amount left to cover operating expenses and profit, and it is the numerator of GMROI.
- Gross margin percentage
- Gross margin dollars divided by net sales, expressed as a percentage.
- Average inventory at cost
- The typical value of inventory held during the period, valued at what the retailer paid rather than at retail price. A simple estimate is \(\frac{\text{Beginning inventory} + \text{Ending inventory}}{2}\). Averaging more points (such as monthly balances) is more accurate for seasonal businesses.
- Inventory turnover
- How many times inventory is sold and replaced in a period. It is commonly computed as COGS divided by average inventory at cost. Another version divides net sales by average inventory, which is the version used in the GMROI relationship.
- GMROI
- Gross margin dollars divided by average inventory at cost. It measures the gross margin earned per dollar invested in inventory.
FAQ
What is a good GMROI? It varies by industry, but many retailers target a GMROI above 2.0 (200%). Grocery often runs lower, while high-margin specialty goods run higher.
How is GMROI different from gross margin percentage? Gross margin % measures profit relative to sales. GMROI measures profit relative to inventory investment, so it rewards both strong margins and fast inventory turnover.
Should I use inventory at cost or at retail? Use average inventory valued at cost, which matches the basis of the gross-margin figure and produces the standard GMROI result.