What this calculator does
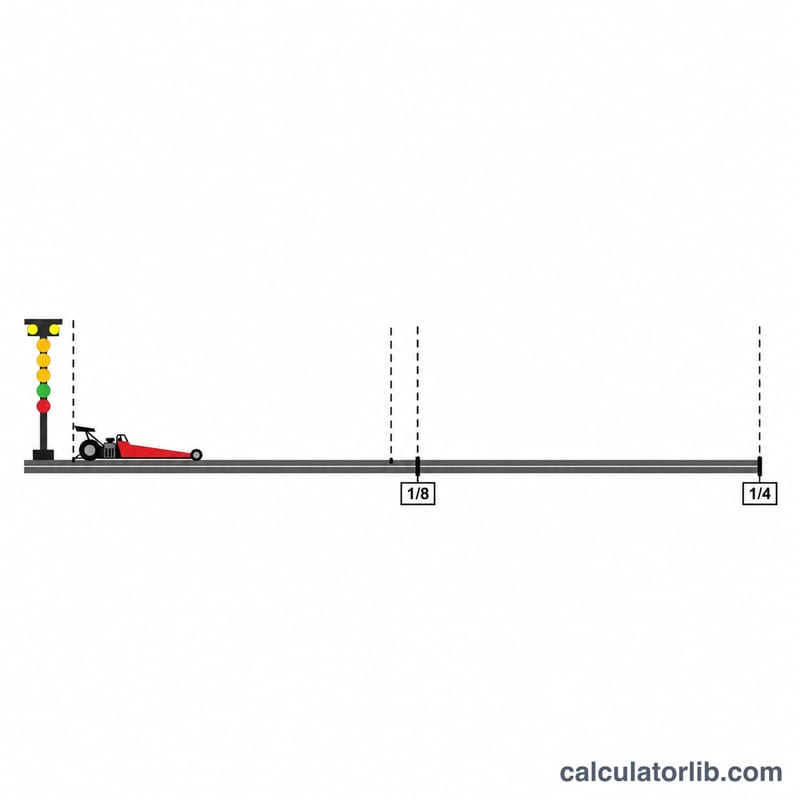
The eighth mile (660 ft) is the standard distance at many local drag strips and street-legal events. This calculator predicts how quickly a car should cover it, and its trap speed, using only two numbers: horsepower and race weight. It also gives your weight-to-power ratio, horsepower per ton, and the matching quarter-mile estimate.
How to use it
Enter the race weight in pounds. Include the driver and fuel, because that is what the car actually carries down the track. Then enter flywheel (crank) horsepower. If you only know wheel horsepower, add roughly 12–18% to cover drivetrain losses before you enter it.
The formula explained
The calculator starts from the well-known Hale quarter-mile equations. Here \(W\) is race weight in lb and \(P\) is horsepower:
$$ET_{1/4} = 5.825\sqrt[3]{\frac{W}{P}}, \qquad v_{1/4} = 234\sqrt[3]{\frac{P}{W}}$$It then converts them to the eighth mile with ratios that racers widely use. A quarter-mile ET is about 1.5455 times the eighth-mile ET, and the quarter-mile trap speed is about 1.255 times the eighth-mile speed:
$$ET_{1/8} = \frac{ET_{1/4}}{1.5455}, \qquad v_{1/8} = \frac{v_{1/4}}{1.255}$$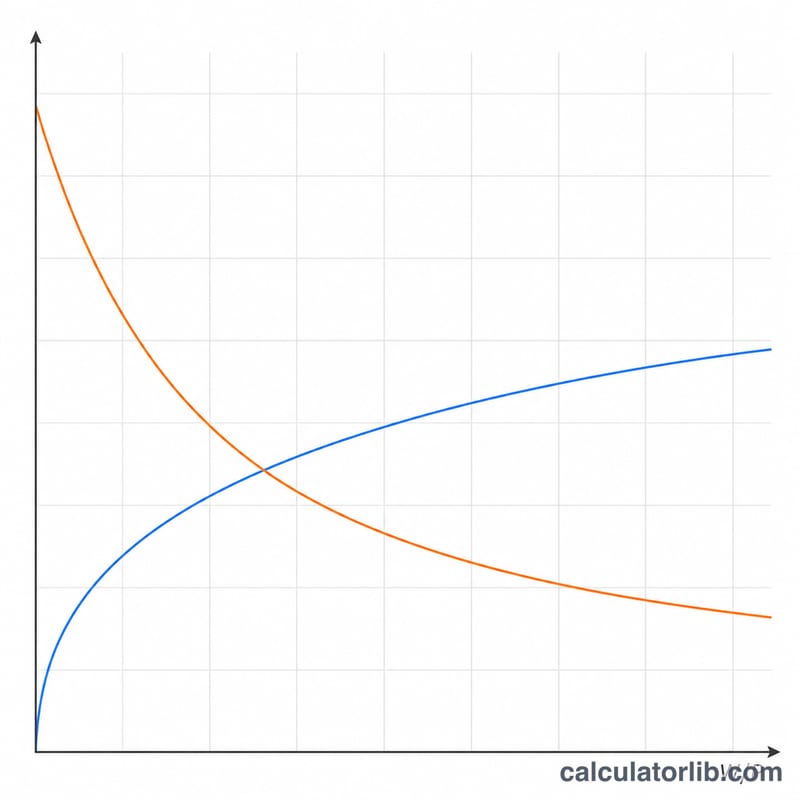
Worked example
Take a 3,200 lb car that makes 400 hp. The weight-to-power ratio is \(3200/400 = 8\) lb/hp, and its cube root is exactly 2.
$$ET_{1/4} = 5.825 \times 2 = 11.65\,\text{s}, \quad ET_{1/8} = \frac{11.65}{1.5455} = 7.54\,\text{s}$$$$v_{1/4} = \frac{234}{2} = 117\,\text{mph}, \quad v_{1/8} = \frac{117}{1.255} = 93.2\,\text{mph}$$Estimated 1/8 Mile Times for Common Power-to-Weight Combinations
The table shows six typical builds, from an economy car to a high-power street/strip car. Every value uses the Hale formula for the quarter mile. The 1/8 mile figures are then found by dividing the quarter-mile ET by 1.5455 and the quarter-mile trap speed by 1.255:
$$\text{ET}_{1/4} = 5.825\sqrt[3]{W/P} \qquad \text{MPH}_{1/4} = 234\sqrt[3]{P/W}$$$$\text{ET}_{1/8} = \frac{\text{ET}_{1/4}}{1.5455} \qquad \text{MPH}_{1/8} = \frac{\text{MPH}_{1/4}}{1.255}$$Hp per ton uses the US short ton of 2,000 lb: \(\text{hp/ton} = P \div (W/2000)\).
| Example vehicle | Weight (lb) | Horsepower | lb/hp | hp per ton | 1/8 mile ET (s) | 1/8 trap (mph) | 1/4 mile ET (s) | 1/4 trap (mph) |
|---|---|---|---|---|---|---|---|---|
| Economy car | 3,500 | 200 | 17.5 | 114.3 | 9.79 | 71.8 | 15.12 | 90.1 |
| V6 sedan | 3,400 | 300 | 11.3 | 176.5 | 8.47 | 83.0 | 13.08 | 104.2 |
| Sports coupe | 3,200 | 400 | 8.0 | 250.0 | 7.54 | 93.2 | 11.65 | 117.0 |
| Muscle car | 3,600 | 500 | 7.2 | 277.8 | 7.28 | 96.6 | 11.25 | 121.2 |
| Modified performance car | 3,000 | 600 | 5.0 | 400.0 | 6.44 | 109.0 | 9.96 | 136.8 |
| Serious street/strip build | 2,800 | 800 | 3.5 | 571.4 | 5.72 | 122.8 | 8.84 | 154.1 |
Here is the full working for the 3,200 lb / 400 hp coupe. The weight-to-power ratio is \(3200/400 = 8\), and \(\sqrt[3]{8} = 2\), so \(\text{ET}_{1/4} = 5.825 \times 2 = 11.65\) s and \(\text{ET}_{1/8} = 11.65 / 1.5455 \approx 7.54\) s. Trap speed works the same way: \(\text{MPH}_{1/4} = 234 / 2 = 117.0\) mph and \(\text{MPH}_{1/8} = 117.0 / 1.255 \approx 93.2\) mph.
Note: These are ideal-traction estimates. They assume the horsepower is accurate crank horsepower, the race weight includes the driver, and the car launches cleanly. Real time slips are usually slower because of wheelspin, gearing, shift time, air density and track conditions.
What Your Estimate Means on the Track
Treat the result as a theoretical best. The Hale-based formulas were built around crank (flywheel) horsepower and a car that puts its power down well. If you enter wheel horsepower, the estimate will come out a little slow. If you enter an optimistic advertised figure, it will come out too quick.
Comparing your time slip with the estimate
- Trap speed close to the estimate but ET slower: this usually means a launch or traction problem. Trap speed mostly reflects how much power the car has. ET also depends heavily on the first 60 ft, so wheelspin, a soft launch, the wrong tyre pressure or a slow first shift will show up in ET first.
- Trap speed well below the estimate: the car is probably making less power than you entered, or it weighs more than you think. Check the real race weight with the driver and fuel included. Also look for heat soak, poor tuning or drivetrain losses that are higher than expected.
- Both numbers better than the estimate: the car may have more power than entered, very effective gearing, or ideal air conditions.
Approximate 1/8 mile ET bands
These bands are broad, descriptive ranges for context. They are not an official classification from any sanctioning body:
| Approximate 1/8 mile ET | Typical type of vehicle |
|---|---|
| Roughly 10 s or slower | Typical commuter and economy cars |
| About 8–9 s | Quick sports cars and strong performance sedans |
| About 7 s | Fast muscle and modified cars |
| 7 s or less | Serious performance builds |
About the 1/8-to-1/4 mile conversion
The divisors 1.5455 (ET) and 1.255 (trap speed) are common drag-racing rules of thumb, not exact physics. A car with short gearing or a strong launch tends to look relatively better over the eighth mile. A car with tall gearing, good aerodynamics or a lot of top-end power tends to gain more in the second half of the quarter. Use the projected quarter-mile numbers as a rough guide only, and trust real time slips over any estimate.
FAQ
Why is my real time slower than the estimate?
These equations assume good traction and a clean launch. Wheelspin, a poor 60-foot time, tall gearing, an automatic transmission or hot, humid air can all add time. Trap speed usually tracks power more closely than ET does.
Can I work backward from a time slip?
Yes. Try different horsepower values until the predicted trap speed matches your slip. The result is a rough estimate of the power your car is really making.
Does it work for motorcycles?
Only roughly. Bikes are wheelie-limited off the line, so their real ETs are often slower than predicted even when the trap speed matches.