What Is Market Capitalization?
Market capitalization, or "market cap," is the total dollar value of a publicly traded company's outstanding shares of stock. It represents what the market collectively believes the company's equity is worth at a given moment. Market cap is one of the most widely used metrics for sizing companies and is the basis for classifications like large-cap, mid-cap, and small-cap.

How to Use This Calculator
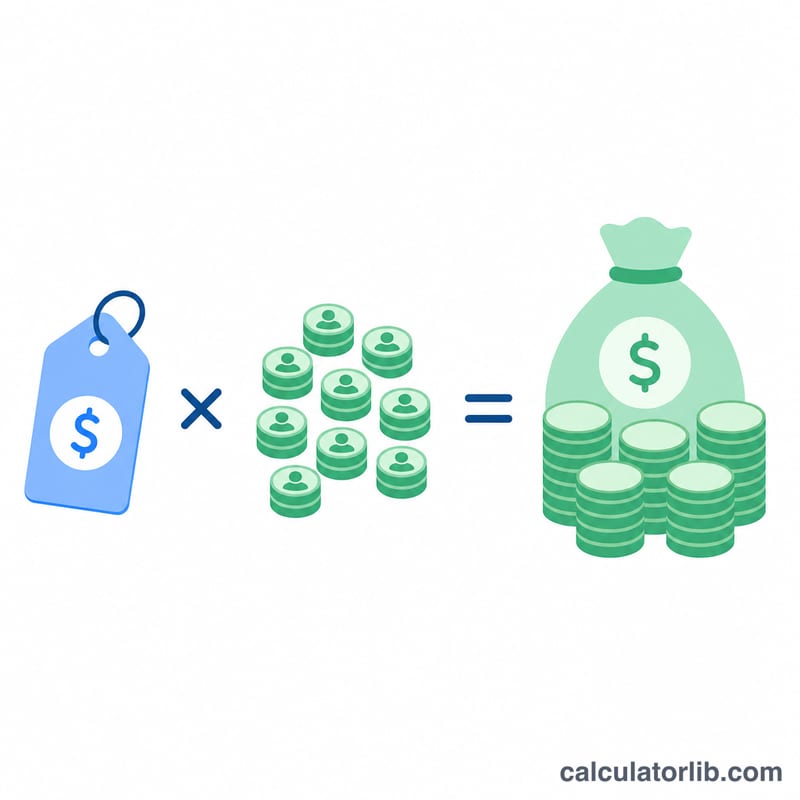
Enter the current share price (the price of one share of stock) and the total shares outstanding (the number of shares the company has issued and that are held by investors). The calculator multiplies the two values and returns the market cap in dollars, along with convenient conversions to millions and billions.
The Formula Explained
The calculation is straightforward:
$$\text{Market Cap} = \text{Share Price (\$)} \times \text{Total Shares Outstanding}$$
Because share price changes constantly during trading, market cap fluctuates in real time. Shares outstanding can change too — through buybacks, new issuance, or stock splits — so always use the most recent figures for an accurate result.
Worked Example
Suppose a company's stock trades at $150 per share and it has 1,000,000,000 (one billion) shares outstanding. Its market cap is:
$$\$150 \times 1{,}000{,}000{,}000 = \$150{,}000{,}000{,}000$$ or $150 billion. This would place the company firmly in large-cap territory.
Market Cap Classification Tiers
Investors often group companies by market capitalization. The approximate US dollar thresholds below are commonly cited conventions. They are not fixed rules.
| Tier | Approximate market cap (USD) |
|---|---|
| Mega-cap | Above $200 billion |
| Large-cap | $10 billion – $200 billion |
| Mid-cap | $2 billion – $10 billion |
| Small-cap | $300 million – $2 billion |
| Micro-cap | $50 million – $300 million |
| Nano-cap | Below $50 million |
Note: Index providers, brokerages, and data sources draw these boundaries differently, and some update them over time. The same company can be labeled mid-cap by one source and large-cap by another. The tiers are also expressed in US dollars and are most often used for US-listed stocks. Other markets may use local-currency or relative (percentile-based) definitions.
Market Cap Under Different Price and Share Scenarios
The table uses hypothetical numbers. The baseline is a share price of $150 and 1 billion shares outstanding, so market cap = $150 × 1,000,000,000. Each scenario changes only the items listed. In the buyback and issuance rows, the share price is assumed to stay at $150 to isolate the effect of the share count.
| Scenario | Share price | Shares outstanding | Market cap | Change vs. baseline |
|---|---|---|---|---|
| Baseline | $150.00 | 1,000,000,000 | $150,000,000,000 ($150B) | — |
| Price rises 10% | $165.00 | 1,000,000,000 | $165,000,000,000 ($165B) | +10% |
| Price falls 20% | $120.00 | 1,000,000,000 | $120,000,000,000 ($120B) | −20% |
| Buyback cuts shares by 5% | $150.00 | 950,000,000 | $142,500,000,000 ($142.5B) | −5% |
| New issuance adds 5% shares | $150.00 | 1,050,000,000 | $157,500,000,000 ($157.5B) | +5% |
| 2-for-1 stock split | $75.00 | 2,000,000,000 | $150,000,000,000 ($150B) | 0% |
Arithmetic check for the split: \(\$75 \times 2{,}000{,}000{,}000 = \$150{,}000{,}000{,}000\). The per-share price halves and the share count doubles, so the total value is unchanged.
In practice, a buyback or issuance would also change the share price, because cash leaves or enters the company. The table isolates the arithmetic and is not a forecast.
Key Terms and Glossary
- Share price
- The most recent price at which one share traded on an exchange.
- Shares outstanding
- The total number of shares currently held by all shareholders, including insiders and institutions. Treasury shares (shares the company has repurchased and holds) are excluded.
- Float (free float)
- The portion of shares outstanding that is available for public trading. It excludes shares held by insiders, founders, governments, or other strategic holders. Standard market capitalization uses shares outstanding, not float. Float-adjusted market cap is a separate measure that some index providers use for weighting.
- Diluted shares
- Shares outstanding plus potential shares from options, warrants, convertible securities, and restricted stock units, if all were exercised or converted. Diluted market cap uses this larger count.
- Authorized vs. issued shares
- Authorized shares are the maximum a company's charter allows it to issue. Issued shares are those actually sold or granted. Issued shares minus treasury shares equal shares outstanding. Market cap should not be computed from authorized shares.
- Enterprise value (EV)
- A broader measure of a company's total value: market cap plus debt and other claims such as preferred stock and minority interests, minus cash and cash equivalents. Unlike market cap, it reflects the company's capital structure.
- Large-cap, mid-cap, small-cap
- Informal size categories based on market cap. Large-caps are the biggest companies, mid-caps are in the middle, and small-caps are smaller. Exact dollar boundaries vary by source.
- Stock split
- A corporate action that changes the number of shares and the per-share price by the same ratio. In a 2-for-1 split, holders get twice as many shares and the price halves. Market cap does not change in theory.
FAQ
Is market cap the same as company value? Not exactly. Market cap measures equity value only. Enterprise value adds net debt and is often a better measure of total takeover cost.
What counts as large-cap? Conventionally, companies above roughly $10 billion are large-cap, $2–10 billion are mid-cap, and under $2 billion are small-cap.
Why does market cap change daily? Because share price moves with supply and demand in the market, the market cap recalculates every time the price ticks up or down.