What is a Mean Calculator?
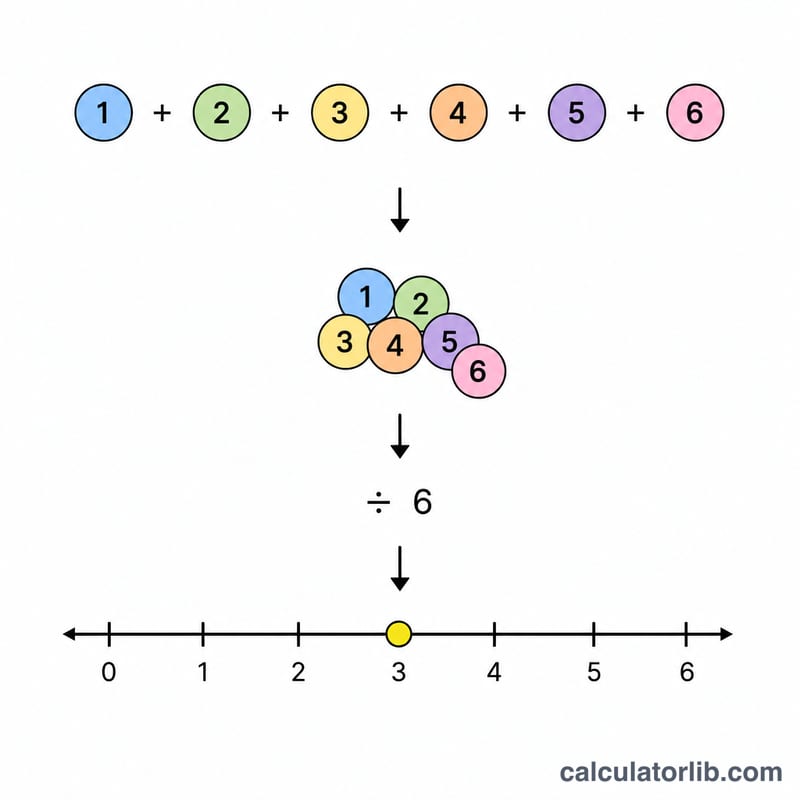
A mean calculator is a mathematical tool that computes the average value of a set of numbers. The mean (or arithmetic mean) represents the central value of a dataset and is calculated by adding all values in the dataset and dividing by the total number of values.
When to Use a Mean Calculator
A mean calculator is useful in various scenarios:
- Analyzing academic performance by calculating average test scores
- Evaluating financial data such as average monthly expenses or investment returns
- Processing scientific measurements to determine average values from multiple trials
How to Calculate Mean
The formula for calculating the arithmetic mean is:
Mean = (x₁ + x₂ + x₃ + ... + xₙ) / n
Where:
- x₁, x₂, x₃, ... xₙ represent the individual values in the dataset
- n is the total number of values in the dataset
Examples
Example 1: Calculate the mean of test scores
Find the mean of the following test scores: 85, 92, 78, 90, 88
| Values | 85, 92, 78, 90, 88 |
|---|---|
| Sum of values | 85 + 92 + 78 + 90 + 88 = 433 |
| Number of values | 5 |
| Mean | 433 ÷ 5 = 86.6 |
Example 2: Calculate the mean of monthly expenses
Find the mean of monthly expenses for the first quarter: $1250, $980, $1320
| Values | $1250, $980, $1320 |
|---|---|
| Sum of values | $1250 + $980 + $1320 = $3550 |
| Number of values | 3 |
| Mean | $3550 ÷ 3 = $1183.33 |
Additional Information
While the mean is a common measure of central tendency, it may be influenced by outliers or extreme values in the dataset. In such cases, you might want to consider other measures of central tendency such as the median or mode.
Related Tools
- Standard Deviation Calculator - Measure the dispersion of a dataset
- Variance Calculator - Calculate the variance of a set of numbers
- Average Calculator - Calculate different types of averages
- Mid Range Calculator - Find the midpoint between the highest and lowest values
Interpreting the Mean, Count, Min and Max
The calculator returns four numbers that are best read together: the mean (the arithmetic average), the count (how many values you entered), and the min and max (the smallest and largest values).
- The mean lies between min and max. The average can never be smaller than the smallest value or larger than the largest. If a result falls outside that interval, there is a data-entry or typing error. If min equals max, every value is the same and the mean equals that value.
- Range shows spread. The range is \(\text{max} - \text{min}\). A small range means the values are tightly clustered, so the mean is a good summary. A large range means the values are spread out, and the mean alone hides that variation.
- The mean need not be in the dataset. The mean of 2, 3 and 4 is 3, but the mean of 1, 2 and 4 is \(\frac{7}{3} \approx 2.33\), which is not one of the values. The mean can also be a fraction or decimal even when every input is a whole number.
- One extreme value pulls the mean. Take 10, 12, 11, 13, 100. The sum is 146, so the mean is \(\frac{146}{5} = \)29.2. Yet four of the five values are between 10 and 13. The median (the middle value when sorted: 10, 11, 12, 13, 100) is 12, which describes the typical value far better. Without the 100, the mean would be \(\frac{46}{4} = 11.5\). Here the range is \(100 - 10 = 90\), a warning sign that something is pulling the average.
- Count affects reliability. A mean of 3 values can swing a lot when one value changes; a mean of 300 values is much more stable. With a small count, treat the mean as a rough summary. If the data are a sample from a larger group, a larger count generally gives a more dependable estimate of the group's true average.
- When to compare with the median or mode. If the data are skewed or contain outliers (incomes, house prices, response times), compare the mean with the median. A mean well above the median suggests a few large values; a mean well below suggests a few very small ones. Use the mode for repeated or categorical-like values (for example, the most common shoe size), where the most frequent value matters more than the average.
Key Terms: Mean, Median, Mode, Range
- Arithmetic mean
- The sum of all values divided by how many there are: \(\text{Mean} = \frac{\sum x}{n}\).
- Median
- The middle value of the sorted data; with an even count, the average of the two middle values.
- Mode
- The value that occurs most often. A dataset can have one mode, several, or none if no value repeats.
- Count (n)
- The number of values in the list.
- Minimum
- The smallest value in the list.
- Maximum
- The largest value in the list.
- Range
- The maximum minus the minimum; a simple measure of spread.
- Outlier
- A value unusually far from the rest of the data, which can distort the mean.
- Central tendency
- A single value that summarizes where the data are centered; the mean, median and mode are the three common measures.
Other means: the arithmetic mean gives every value equal importance. The weighted mean gives values different weights, the geometric mean is the n-th root of the product of the values (used for growth rates and ratios), and the harmonic mean is n divided by the sum of reciprocals (used for averaging rates such as speeds over equal distances).
Conventions and edge cases
Each case below was run through this calculator; the result column is what it actually returns.
| Case | Input | Result |
|---|---|---|
| Decimals 0.1, 0.2, 0.3 | 0.1, 0.2, 0.3 | 0.2 |
| Even number of values (1, 2, 3, 4) | 1, 2, 3, 4 | 2.5 |
| Negative values (−3, −1, 4) | -3, -1, 4 | 0 |
| A zero in the list (0, 4, 9) | 0, 4, 9 | 4.3333 |
| Sample or population (2, 4, 4, 4, 5, 5, 7, 9) | 2, 4, 4, 4, 5, 5, 7, 9 | 5 |
| A single value | 7 | 7 |
Checked on 2026-11-08