What This Calculator Does
Given a sinusoidal function written in the standard form \(y = \text{A}\sin(\text{B}x - \text{C}) + \text{D}\) (the same logic applies to cosine), this tool instantly returns the four key features that define its graph: the amplitude, the period, the phase shift, and the midline. These four values let you sketch or analyze any sine or cosine wave without plotting points by hand.
How to Use It
Enter the four coefficients from your equation: A (the amplitude coefficient), B (the coefficient of x inside the function), C (the constant subtracted inside), and D (the constant added outside). Make sure your equation is in the form $$y = \text{A}\sin(\text{B}x - \text{C}) + \text{D}$$ If your equation factors B differently, for example \(y = \text{A}\sin(\text{B}(x - h)) + \text{D}\), then \(\text{C} = \text{B}\cdot h\). Press calculate to see all four properties.
The Formulas Explained
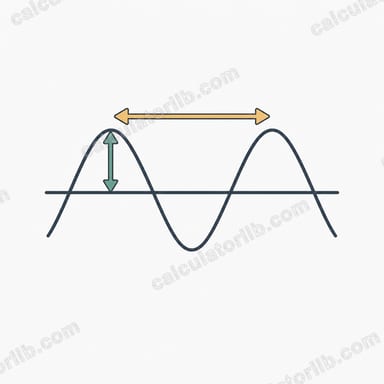
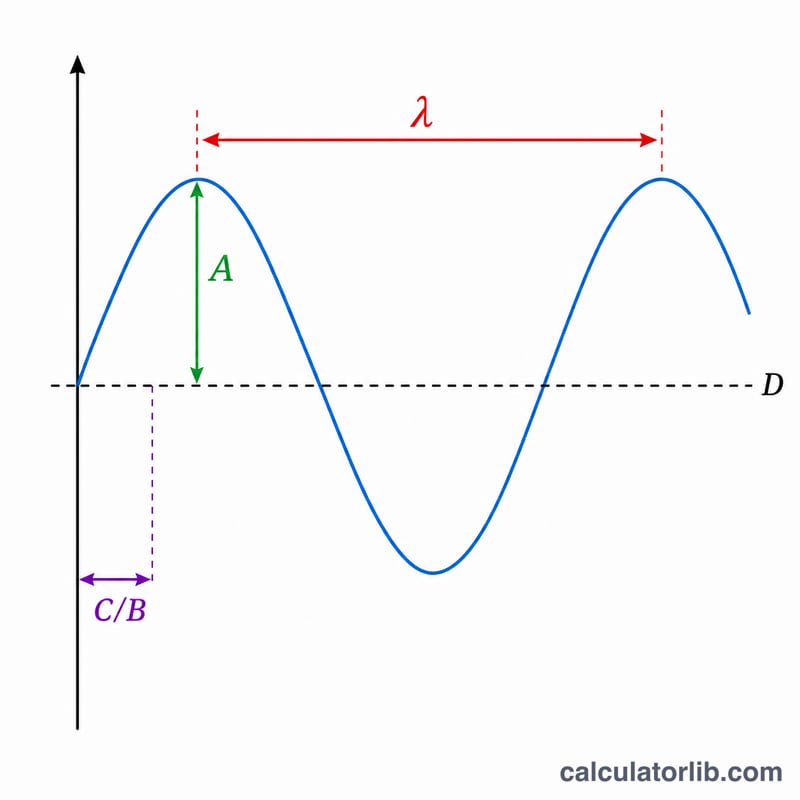
\(\text{Amplitude} = \left|\text{A}\right|\). It is the vertical distance from the midline to a peak. The sign of A only flips the wave; the amplitude is always positive.
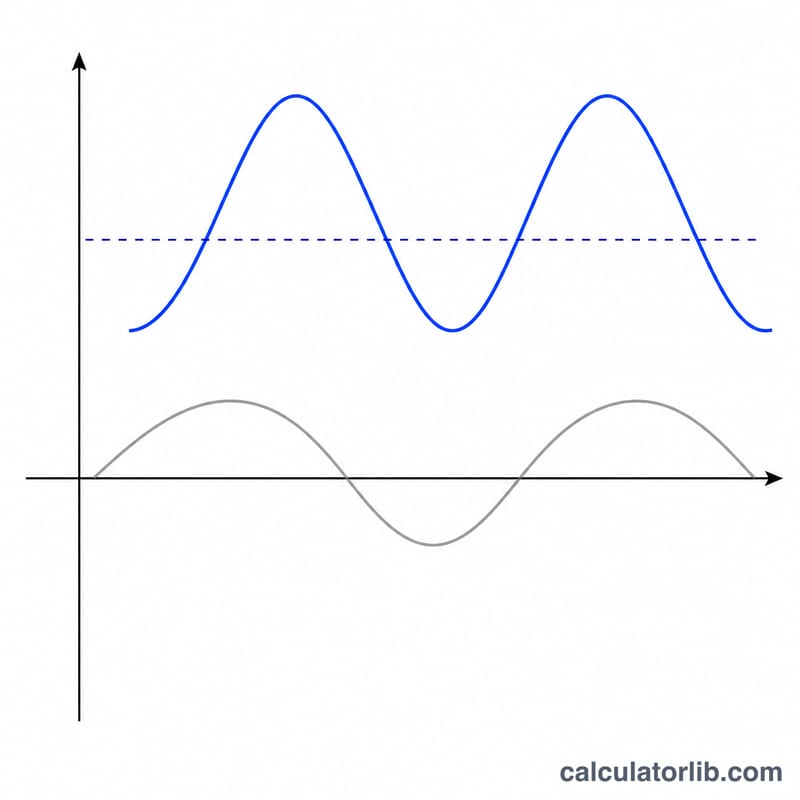
\(\text{Period} = \dfrac{2\pi}{\left|\text{B}\right|}\). A larger \(\left|\text{B}\right|\) compresses the wave horizontally, shortening the period. \(\text{Phase shift} = \dfrac{\text{C}}{\text{B}}\). A positive result shifts the graph to the right, a negative result to the left. \(\text{Midline} = \text{D}\), the horizontal line the wave oscillates about.
Worked Example
For \(y = 2\sin(3x - 1) + 4\):
$$\text{amplitude} = \left|2\right| = 2; \quad \text{period} = \frac{2\pi}{3} \approx 2.0944; \quad \text{phase shift} = \frac{1}{3} \approx 0.3333 \ (\text{to the right}); \quad \text{midline} = y = 4$$So the curve oscillates between \(y = 2\) and \(y = 6\), repeating every \(2.0944\) units.
FAQ
Does this work for cosine? Yes. Amplitude, period, phase shift and midline use identical formulas for \(y = \text{A}\cos(\text{B}x - \text{C}) + \text{D}\).
Why is my phase shift negative? A negative phase shift means the graph moves to the left compared with the parent sine curve.
What if B is 0? A zero B makes the function constant (no oscillation), so period and phase shift are undefined; the tool returns 0 in that case.


