
What is an Options Spread Calculator?
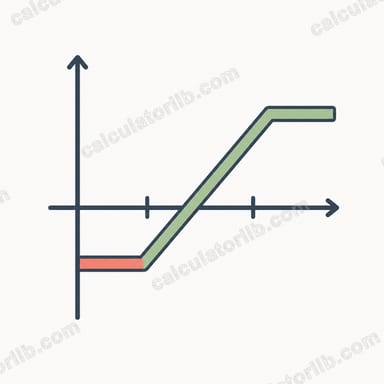
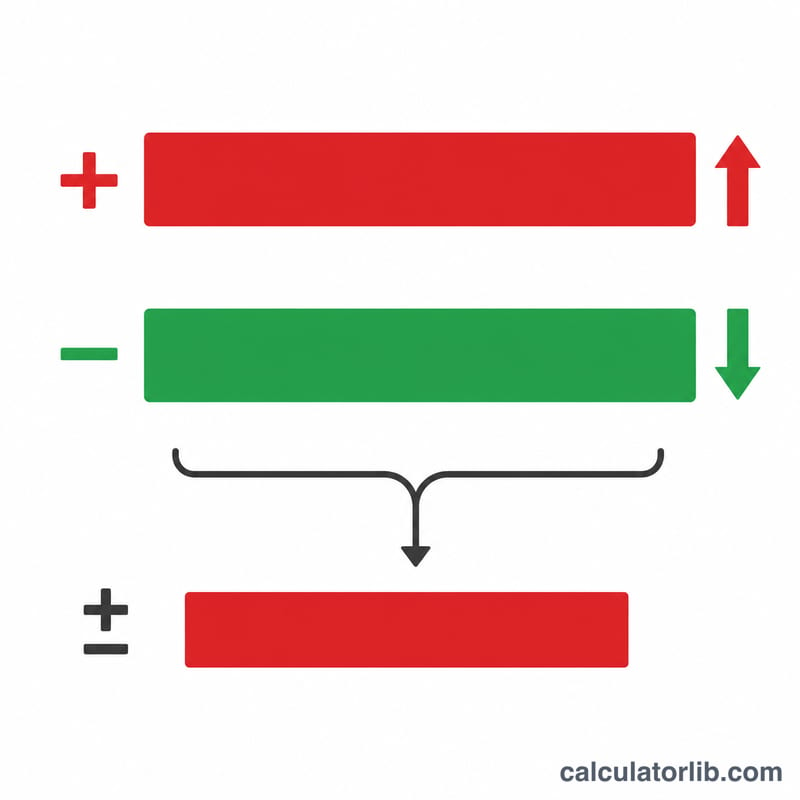
This tool analyzes a vertical debit spread — a strategy where you buy one option (the long leg) and sell another option of the same type and expiry at a different strike (the short leg). Because you pay more for the long leg than you receive for the short leg, the trade opens for a net debit. The calculator instantly returns your net debit, maximum profit, maximum loss, breakeven price and risk/reward ratio, both per share and across all contracts.
How to Use It
Enter the premium you pay for the long option and the premium you collect from the short option. Add the two strike prices and the number of contracts. Since one standard equity option controls 100 shares, the calculator multiplies per-share figures by \(100 \times \text{contracts}\) to give your real dollar outcome.
The Formula Explained
Net Debit = Long Premium − Short Premium. This is your cost basis and also your maximum loss. The Max Profit equals the distance between the strikes minus the net debit: |Short Strike − Long Strike| − Net Debit. The Breakeven for a bull call spread is the Long Strike + Net Debit.
$$\text{Max Profit} = \left(\left|\,\text{Short Strike} - \text{Long Strike}\,\right| - D\right) \times 100 \times \text{Contracts}$$ $$\text{where}\quad \left\{ \begin{aligned} D &= \text{Long Premium} - \text{Short Premium} \\ \text{Breakeven} &= \text{Long Strike} + D \\ \text{Max Loss} &= D \times 100 \times \text{Contracts} \end{aligned} \right.$$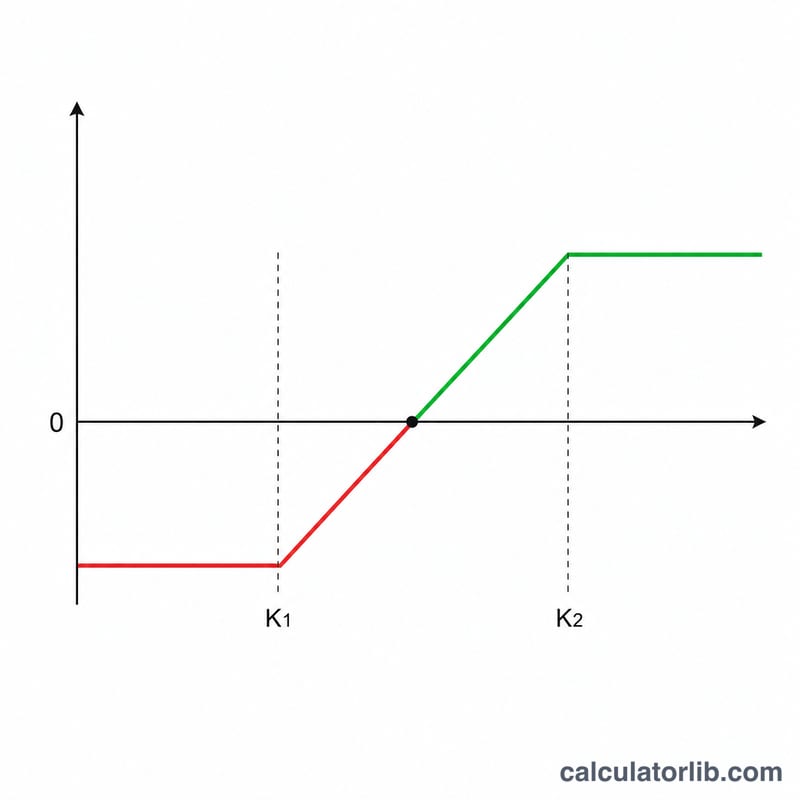
Worked Example
Suppose you buy a $100 call for $5.00 and sell a $110 call for $2.00, one contract. Net Debit = $$5 - 2 = \$3.00$$ per share. Strike width = 10. Max Profit = $$10 - 3 = \$7.00$$ per share, or $700 total. Max Loss = $3.00 per share, or $300 total. Breakeven = $$100 + 3 = \$103.$$ Risk/reward = $$7 \div 3 \approx 2.33.$$
FAQ
Does this work for credit spreads? It is built for debit spreads. A credit spread produces a negative net debit, which simply flips the sign of profit and loss.
Why multiply by 100? Each US equity option contract represents 100 underlying shares, so dollar P/L is the per-share value times 100 times the number of contracts.
Are commissions included? No. Subtract your broker's per-contract fees from the results for a precise net figure.