What Is a Pivot Point Calculator?
A pivot point calculator computes key intraday price levels traders use to gauge potential support and resistance. Based on the previous period's high, low and close, it produces a central pivot (PP) plus three resistance levels (R1, R2, R3) and three support levels (S1, S2, S3). These levels are widely used in stocks, forex and futures day trading. This tool uses the classic (standard) pivot point method.
How to Use It
Enter the prior period's High, Low and Close prices — typically yesterday's daily values for an intraday plan, or the previous week/month for longer-term levels. Click calculate and the tool instantly returns the pivot and all support/resistance lines. Plot these on your chart: price trading above PP suggests bullish bias, below PP bearish bias.
The Formula Explained
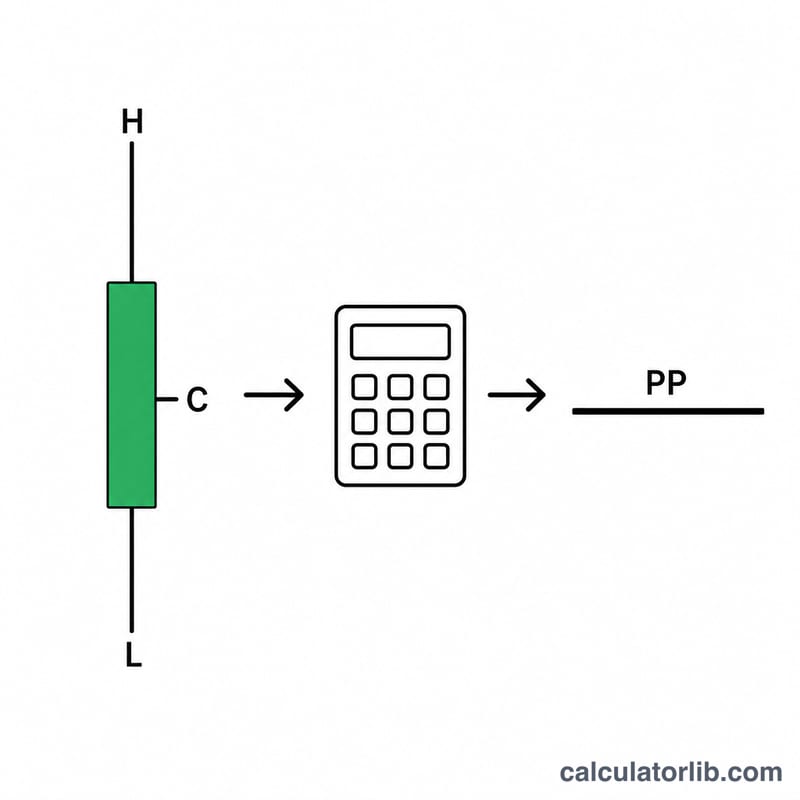
The pivot itself is the simple average of high, low and close: \(PP = \dfrac{H + L + C}{3}\). The other levels build outward:
$$\begin{aligned} R1 &= 2\cdot PP - \text{Low} \\ S1 &= 2\cdot PP - \text{High} \\ R2 &= PP + (\text{High} - \text{Low}) \\ S2 &= PP - (\text{High} - \text{Low}) \\ R3 &= \text{High} + 2\cdot(PP - \text{Low}) \\ S3 &= \text{Low} - 2\cdot(\text{High} - PP) \end{aligned}$$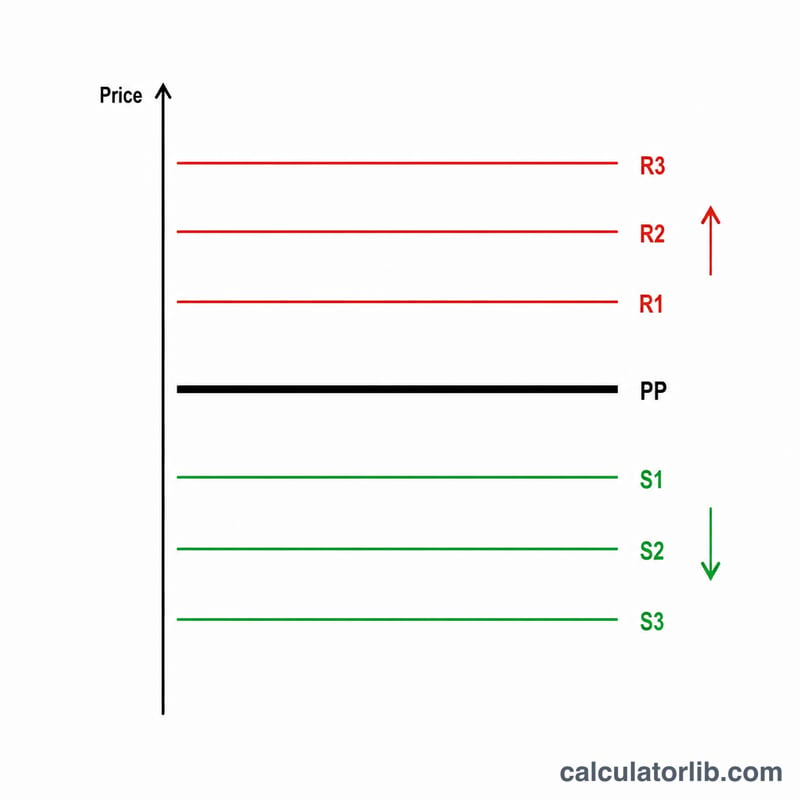
Worked Example
Suppose yesterday's High = 110, Low = 90, Close = 105. Then $$PP = \frac{110 + 90 + 105}{3} = \frac{305}{3} = 101.6667.$$ \(R1 = 2\cdot 101.6667 - 90 = 113.3333\), \(S1 = 2\cdot 101.6667 - 110 = 93.3333\), \(R2 = 101.6667 + 20 = 121.6667\), \(S2 = 101.6667 - 20 = 81.6667\).
Interpreting Pivot Point Levels
Classic pivot points turn the previous period's High, Low and Close into a set of seven horizontal reference levels: the central pivot point (PP), three resistance levels (R1–R3) above it and three support levels (S1–S3) below it. The period is usually a day, week or month, depending on the chart being analysed.
- Pivot point (PP): the average of High, Low and Close, \(PP = \frac{H + L + C}{3}\). Price trading above PP is conventionally read as a bullish bias, and price below PP as a bearish bias.
- R1 and S1: the levels closest to PP. They are the first reference points price meets when it moves away from the pivot.
- R2 and S2: sit exactly one previous-period range (High − Low) above and below PP, so they scale with how wide the last period was.
- R3 and S3: the outer extremes. Price reaching them means a move well beyond the previous period's range, which is comparatively uncommon.
Traders commonly watch these levels as potential reference points, where price may stall or reverse (often described as support or resistance) or where it may break through and continue. Whether that happens in any given session is not determined by the levels themselves.
Important limits: pivot levels are calculated purely from past prices. They are not forecasts and not trading advice. They are usually combined with other tools, such as trend lines, moving averages, volume or momentum indicators, rather than used alone.
Classic Pivot Levels Across Different Scenarios
The table applies the classic formulas to four example sets of prices (the numbers are illustrative, not market data): \(PP=\frac{H+L+C}{3}\), \(R1=2PP-L\), \(S1=2PP-H\), \(R2=PP+(H-L)\), \(S2=PP-(H-L)\), \(R3=H+2(PP-L)\), \(S3=L-2(H-PP)\).
| Scenario | High | Low | Close | PP | R1 | R2 | R3 | S1 | S2 | S3 |
|---|---|---|---|---|---|---|---|---|---|---|
| Close near high | 110 | 100 | 108 | 106 | 112 | 116 | 122 | 102 | 96 | 92 |
| Close near low | 110 | 100 | 102 | 104 | 108 | 114 | 118 | 98 | 94 | 88 |
| Narrow range | 52 | 50 | 51 | 51 | 52 | 53 | 54 | 50 | 49 | 48 |
| Wide range | 150 | 100 | 119 | 123 | 146 | 173 | 196 | 96 | 73 | 46 |
Worked check (close near high)
\(PP = \frac{110 + 100 + 108}{3} = \frac{318}{3} = 106\)
\(R1 = 2(106) - 100 = 112\), \(S1 = 2(106) - 110 = 102\)
\(R2 = 106 + (110 - 100) = 116\), \(S2 = 106 - 10 = 96\)
\(R3 = 110 + 2(106 - 100) = 122\), \(S3 = 100 - 2(110 - 106) = 92\)
What the comparison shows
- R2 and S2 are always exactly the High − Low range away from PP: 10 in the first two rows, 2 in the narrow row and 50 in the wide row.
- When the Close is near the High, PP and every level shift upward relative to the same High–Low range; when the Close is near the Low, they shift downward (compare rows 1 and 2, which share High 110 and Low 100).
- A wider previous range spreads all six outer levels further from PP, while a narrow range packs them closely together.
FAQ
Which prices should I use? Use the previous completed period's high, low and close. For day trading that's the prior trading day.
Are pivot points reliable? They're a popular reference for likely turning points but should be combined with other analysis and risk management.
What pivot type is this? This calculator uses the classic/standard pivot formula. Other variants (Fibonacci, Camarilla, Woodie) use different multipliers.