What is the Retirement Age Calculator?
This tool tells you the exact calendar date you will reach a chosen retirement age, and how many days and years remain until then. Simply enter your date of birth and your target retirement age, and the calculator projects the date forward and counts down from today.
How to use it
Select your birth year, birth month, and birth day, then enter the age at which you plan to retire (for example 65, 67, or 70). The result shows your retirement date along with a live countdown in days and approximate years.
The formula explained
The retirement date is found by adding your target age in whole years to your date of birth: \(\text{RetirementDate} = \text{DOB} + \text{retirementAge}\). The countdown is the difference between that date and today, measured in days. Years remaining are estimated by dividing the days by \(365.25\) to account for leap years.
$$\begin{gathered} \text{Retirement Date} = \left(\,\text{Birth Year} + \text{Retirement Age}\,\right)\text{-}\text{Month}\text{-}\text{Day} \\[1.5em] \text{Countdown}_{\text{days}} = \frac{\text{Retirement Date} - \text{Today}}{\text{1 day}}, \quad \text{Countdown}_{\text{years}} = \frac{\text{Countdown}_{\text{days}}}{365.25} \end{gathered}$$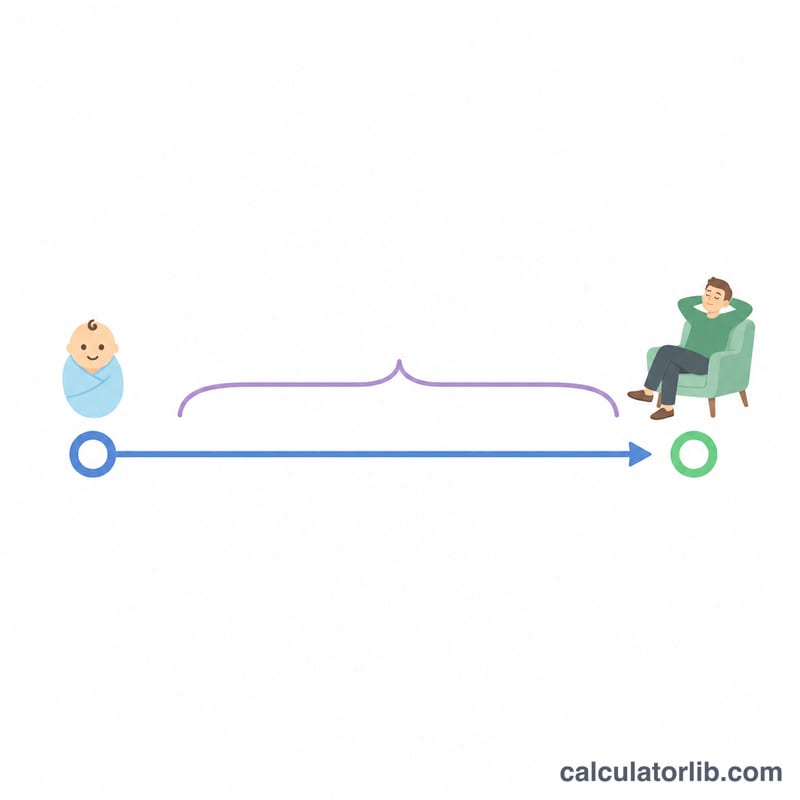
Worked example
Suppose you were born on 1 January 1990 and plan to retire at 67. Your retirement date is 1 January 2057 (\(1990 + 67\)). If today is far before that date, the countdown shows the number of days between today and 1 January 2057, and dividing by \(365.25\) gives the years remaining.
Statutory Retirement & Pension Ages by Country
The ages below are legislated statutory ages set by each country's own pension law — they are not assumptions used by this calculator. This tool applies only the age you enter in the retirement age field, so the table is reference material for choosing that number. Every figure is subject to change by future legislation, and each applies only in the country named; none of them is a universal retirement age, and nothing here is a statement about when anyone should retire or claim.
| Country / scheme | Standard age | Earliest / latest age | Notes |
|---|---|---|---|
| United States — Social Security (OASI) | 67 for people born 1960 or later | Earliest 62; latest useful 70 | "Full retirement age" rises on a sliding scale from 66 to 66 years 10 months for birth years 1943–1959. Claiming at 62 gives a permanently reduced benefit; delayed retirement credits stop accruing at age 70. |
| United Kingdom — State Pension | 66 | No early claim; deferral possible after State Pension age | Legislated to rise to 67 between 2026 and 2028, with a further rise to 68 provided for in law. There is no reduced early State Pension; the pension can only be deferred, not advanced. |
| Canada — Old Age Security (OAS) | 65 | Earliest 65; deferral to 70 | OAS cannot be taken before 65. Deferring past 65 increases the monthly amount, with the increase capped at age 70. |
| Canada — Canada Pension Plan (CPP) | 65 | 60 to 70 | CPP is a separate scheme from OAS with its own age window: reduced if started from 60, increased if started after 65, capped at 70. |
| Australia — Age Pension | 67 | 67 (no early access to the Age Pension) | Reached 67 after a staged increase; superannuation preservation age is a distinct, earlier age set by separate rules. |
| Germany — statutory pension (Regelaltersgrenze) | Rising to 67 | Earlier claim possible with reductions for long-insured people | The standard age has been rising in steps from 65 and reaches 67 for people born in 1964 or later. |
| France — régime général | Minimum age 64 | 64 minimum; 67 for a full rate regardless of contribution quarters | The 2023 reform raises the minimum claiming age in steps to 64. A full-rate pension before 67 also requires a minimum number of contribution quarters. |
Two figures are often confused: the earliest age a pension may be claimed and the age at which it is paid without reduction. The calculator has no view on either — it converts whichever age you type into a calendar date.
Retirement Date by Birth Year and Target Age
Each row adds a whole number of years to the birth date, keeping the same month and day. The countdown columns are measured from 30 September 2026 for illustration; the live tool always measures from today's date, so the day and year counts in your own result will differ from this table and will change every day.
| Birth date | Target age | Retirement date | Days remaining (from 30 Sep 2026) | Years remaining (÷ 365.25) |
|---|---|---|---|---|
| 1 January 1960 | 62 | 1 January 2022 | −1,733 | −4.74 (already past) |
| 1 January 1960 | 67 | 1 January 2027 | 93 | 0.25 |
| 15 June 1975 | 65 | 15 June 2040 | 5,007 | 13.71 |
| 15 June 1975 | 67 | 15 June 2042 | 5,737 | 15.71 |
| 1 January 1990 | 65 | 1 January 2055 | 10,320 | 28.25 |
| 1 January 1990 | 70 | 1 January 2060 | 12,146 | 33.25 |
| 30 September 2000 | 62 | 30 September 2062 | 13,149 | 36.00 |
| 30 September 2000 | 67 | 30 September 2067 | 14,975 | 41.00 |
The first row shows what a past date looks like: a person born 1 January 1960 turned 62 on 1 January 2022, so the countdown is negative — 1,733 days since that date rather than until it. The 30 September 2000 rows land exactly on the reference date's month and day, which is why 13,149 days divides to a clean 36.00 years: \(13{,}149 \div 365.25 = 36.00\).
Raising the target age by one year always adds 365 or 366 days, depending on whether a 29 February falls inside the added year. Comparing the two rows for 1 January 1990: \(12{,}146 - 10{,}320 = 1{,}826\) days for five extra years, which is \(5 \times 365 + 1\) — the single extra day is 29 February 2056.
Interpreting Your Retirement Date and Countdown
The output is a calendar projection, not an eligibility determination. It answers one narrow question: on what date does a person born on the given date reach the given whole-number age, and how far away is that date from today? It does not check contribution records, insurance years, residency, employment status or scheme rules, and it does not know which country's pension system you are in.
- The date itself is exact; the "years remaining" figure is an approximation. The day count is a true difference between two calendar dates. The years figure divides that count by 365.25, the average length of a year in the Gregorian calendar's four-year leap cycle:
$$\text{Countdown}_{\text{years}} = \frac{\text{Countdown}_{\text{days}} }{365.25}$$
Because real intervals contain a whole number of leap days rather than a fractional average, converting the years figure back into a date can land a few days away from the exact retirement date. Use the date and the day count when precision matters. - A negative countdown simply means the date has passed. If the projected date is earlier than today, the day and year figures are negative and measure elapsed time since that birthday. It is not an error and carries no meaning beyond "this age was reached in the past".
- 29 February birth dates need a convention. A person born 29 February reaches most ages in a year that has no 29 February, so the date has to be resolved to either 28 February or 1 March. Calendar tools and legal systems differ on which: some treat the last day of February as the anniversary, others treat 1 March as the day the age is attained. If your birth date is 29 February, expect the projected date to shift by one day against another source, and check which rule the scheme that actually matters to you uses.
- Month-end birth dates are preserved. Because only the year changes, a 31 October birth date always projects to 31 October and a 30 September birth date to 30 September. No month-length adjustment is ever needed outside the 29 February case.
- Many pension systems do not pay from the birthday. A common statutory pattern is that entitlement begins in the month following the month in which the qualifying age is reached, or on the first day of that month; others use the first payment period after the birthday, and payment dates may be weekly, fortnightly or monthly and may shift for weekends and public holidays. So the date shown here can precede the first actual payment date by days or weeks, and by how much depends entirely on the scheme's own rules.
- Age is not the only variable in a real scheme. Reaching the age in the calculator says nothing about reduction factors for early claims, increases for deferral, minimum contribution or insurance periods, or transitional rules for particular birth cohorts. Those are defined by the country and scheme concerned, and several of them use age thresholds different from the one you entered.
This is general information about how the calculation works, not professional financial or pension advice. For a decision that depends on your own record and scheme, the governing figure is the one issued by the relevant pension authority or a qualified adviser.
Life expectancy in United States
How long people in United States live on average from birth, compared with the world, from the World Bank.
- Life expectancy 2024
- 78.9 years
- World 2024
- 73.5 years
- Change since 1960
- +9.1 years
Latest change Up +0.5 years 2024: 78.9 years, against 78.4 years in 2023.
A child born in United States in 2024 can expect to live 78.9 years on average (world: 73.5 years).
| Year | United States | World |
|---|---|---|
| 2024 | 78.9 | 73.5 |
| 2020 | 77.0 | 72.2 |
| 2010 | 78.5 | 70.7 |
| 2000 | 76.6 | 67.7 |
| 1990 | 75.2 | 65.1 |
| 1980 | 73.6 | 62.2 |
| 1970 | 70.8 | 57.9 |
| 1960 | 69.8 | 50.9 |
Life expectancy at birth is an average for the whole population, not a personal prediction.
United States and other countries
Life expectancy at birth, in years — each country’s latest published year.
- Japan 84.0 years (2024)
- South Korea 83.6 years (2024)
- France 83.0 years (2024)
- Saudi Arabia 79.0 years (2024)
- United States 78.9 years (2024)
- China 78.0 years (2024)
- Türkiye 77.4 years (2024)
- Mexico 75.3 years (2024)
- Vietnam 74.7 years (2024)
- World 73.5 years (2024)
- Russia 73.4 years (2024)
- India 72.2 years (2024)
No published figure yet for Taiwan.
Years can differ between rows: each figure is shown with its own year. The same World Bank indicator for every country.
Latest figure: 2024 Data last updated 2026-10-18 · older figure
Source: The World Bank Group CC BY 4.0
Differences and changes are computed by CalculatorLib from these data.
Source details and methodology
- The World Bank Group — World Development Indicators (SP.DYN.LE00.IN)
FAQ
Does this account for official state pension age? No — it uses the retirement age you enter, so check your country's statutory pension age separately.
What if my retirement date has already passed? The countdown will show a negative number, indicating the date is in the past.
Why use 365.25 for years? It averages in leap years so the years-remaining figure is a close approximation rather than a rounded whole number.