What This Calculator Does
The Retirement Income Inflation Calculator shows how much annual income you will need at retirement to enjoy the same lifestyle your money buys today. Because prices rise over time, an income that feels comfortable now may fall well short decades from now. This tool projects today's desired income forward using a compound inflation rate, giving you a realistic withdrawal target for retirement planning. It is a universal math tool and works with any currency.
How to Use It
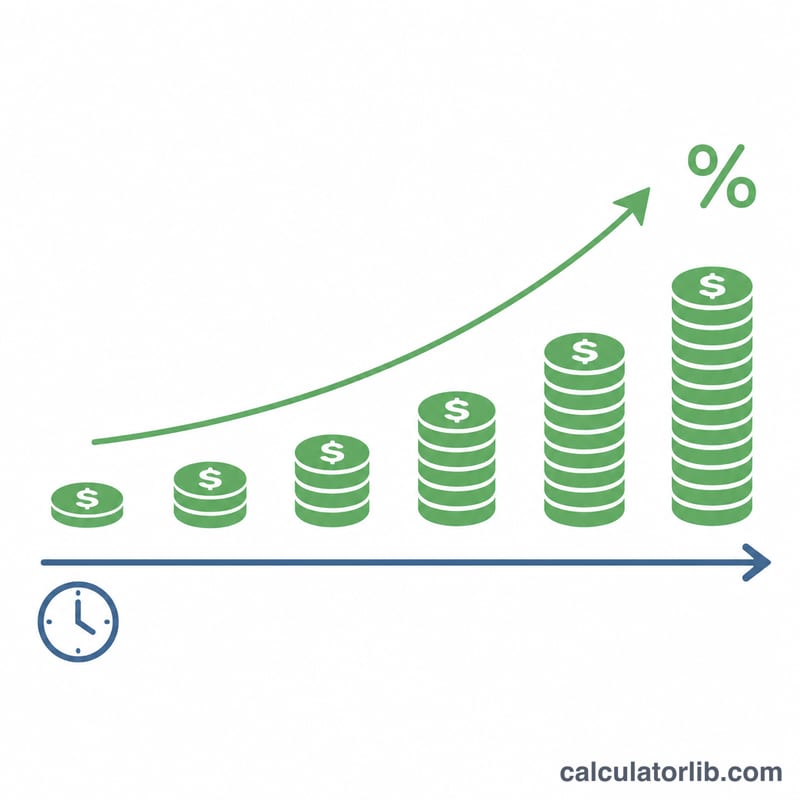
Enter three values: the annual income you would like in today's money, your assumed long-term inflation rate (3% is a common default), and the number of years until you retire. The calculator returns the future income required, the inflation multiplier, and the extra amount inflation adds on top of today's figure.
The Formula Explained
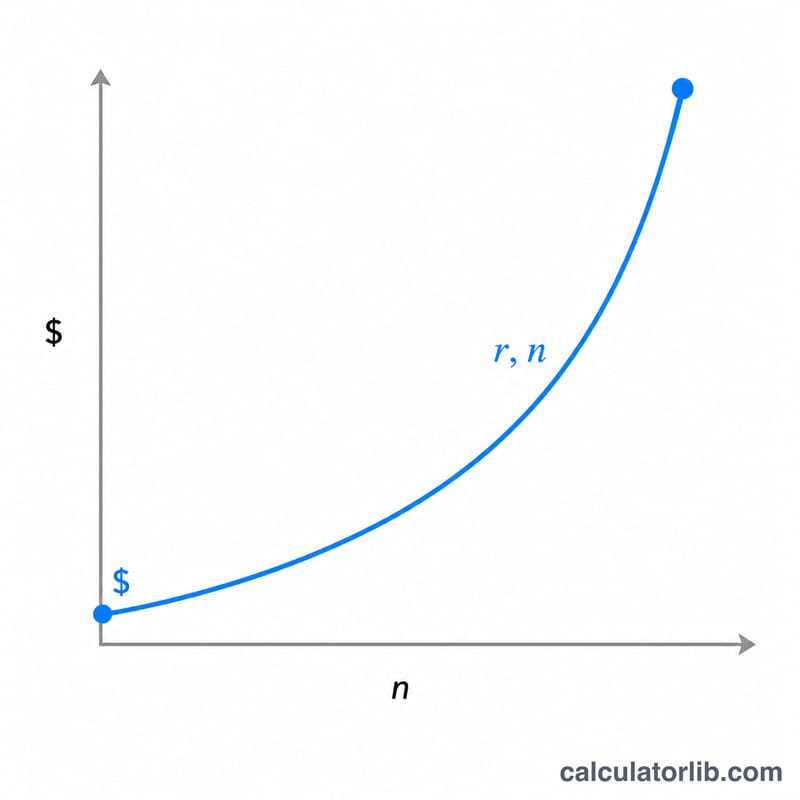
The core equation is $$\text{Future Income Need} = \text{Current Income} \times (1 + r)^{n}$$ where r is the inflation rate as a decimal and n is the number of years. Each year, prices grow by a factor of \((1 + r)\), and compounding over n years gives the multiplier \((1 + r)^{n}\). Multiplying by today's income yields the equivalent future income.
Worked Example
Suppose you want $50,000 a year in today's money, expect 3% inflation, and plan to retire in 20 years. The multiplier is \((1.03)^{20} \approx 1.8061\). So your future need is $$50{,}000 \times 1.8061 \approx \$90{,}305.56$$ per year — about $40,306 more than today simply to stand still against inflation.
Interpreting Your Result
The result is a nominal amount, meaning the number of dollars (or other currency units) you would need in the future to buy what your current income buys today. It does not mean you will be better off; it describes the same purchasing power expressed in future prices.
The multiplier shows how much prices are assumed to rise in total. A multiplier of 1.8061 means that goods and services costing $1.00 today are assumed to cost about $1.81 at retirement, so every $1 of today's spending requires about $1.81 then.
Rule of 72: dividing 72 by the annual inflation rate (in percent) gives a rough doubling time for prices. At 3%, \(72 \div 3 = 24\) years; at 2% it is about 36 years, and at 4% about 18 years. It is an approximation (the exact figure at 3% is about 23.4 years).
Keep these limits in mind:
- The figure is a projection that assumes one constant rate every year. Actual inflation varies year to year and differs between countries and categories of spending, such as healthcare, housing and food.
- Inflation does not stop at retirement. Prices keep rising while you draw income, so the amount needed in later retirement years continues to grow beyond the first-year figure.
- The result covers only the inflation adjustment of the income figure you entered. It does not account for taxes, investment returns, pensions, or changes in your spending.
This is general educational information, not personalized financial advice.
Key Terms
- Inflation rate
- The average annual percentage increase in the general price level of goods and services.
- Purchasing power
- The quantity of goods and services a given amount of money can buy. It falls as prices rise.
- Nominal vs. real income
- Nominal income is the amount in current-year currency units, unadjusted for inflation. Real income is adjusted for inflation so it reflects actual purchasing power. The calculator's output is the nominal amount needed in the future to equal today's real income.
- Inflation multiplier (compound factor)
- The factor \((1+r)^n\) by which prices are assumed to grow over \(n\) years at annual rate \(r\) (as a decimal). Multiplying today's income by it gives the future equivalent.
- Time horizon (years to retirement)
- The number of years between now and the date you plan to start drawing retirement income. A longer horizon means more compounding.
- Withdrawal need
- The annual amount that must be drawn from savings, pensions or other sources to cover spending in retirement. Here it is estimated as today's income expressed in future prices.
Inflation in United States: the official figures
Official consumer-price data for United States, updated automatically. Use these figures as inputs in the calculator above.
- 12-month change, September 2026
- +3.7%
- Inflation 2024
- 2.9%
- Cumulative 2015–2024
- 32.3%
- Average per year
- 3.2%
Latest change Up +0.3 pp September 2026: +3.7%, against +3.4% in August 2026.
Latest month (September 2026): consumer prices in United States changed by +3.7% over 12 months (Consumer Price Index for All Urban Consumers, CPI-U). The yearly figures below are annual averages. CalculatorLib calculates this change from the published index: index of the month ÷ index of the same month a year earlier − 1.
Prices in United States changed by 32.3% between 2015 and 2024, an average of 3.2% a year: what cost 100 USD in 2015 cost about 132 USD in 2024.
| Year | CPI (2010 = 100) | Inflation | World |
|---|---|---|---|
| 2024 | 143.9 | 2.9% | 3.0% |
| 2023 | 139.7 | 4.1% | 5.7% |
| 2022 | 134.2 | 8.0% | 8.0% |
| 2021 | 124.3 | 4.7% | 3.5% |
| 2020 | 118.7 | 1.2% | 1.9% |
| 2019 | 117.2 | 1.8% | 2.2% |
| 2018 | 115.2 | 2.4% | 2.5% |
| 2017 | 112.4 | 2.1% | 2.3% |
| 2016 | 110.1 | 1.3% | 1.6% |
| 2015 | 108.7 | 0.1% | 1.4% |
United States and other countries
Inflation, consumer prices (annual %) — each country’s latest published year.
- Türkiye 34.9% (2025)
- Russia 8.7% (2025)
- Mexico 3.8% (2025)
- Vietnam 3.3% (2025)
- Japan 3.2% (2025)
- World 3.0% (2025)
- United States 2.9% (2024)
- India 2.4% (2025)
- South Korea 2.1% (2025)
- Saudi Arabia 2.0% (2025)
- France 0.9% (2025)
- China 0.1% (2025)
No published figure yet for Taiwan.
Years can differ between rows: each figure is shown with its own year. The same World Bank indicator for every country.
Latest figure: 2026-09 Data last updated 2026-11-14 · current
Source: The World Bank Group CC BY 4.0; U.S. Bureau of Labor Statistics (BLS.gov), Consumer Price Index Public domain (U.S. government work)
The cumulative change, the average yearly rate and the price comparison are computed by CalculatorLib from these data.
Source details and methodology
- The World Bank Group — World Development Indicators (FP.CPI.TOTL.ZG, FP.CPI.TOTL)
- U.S. Bureau of Labor Statistics (BLS.gov), Consumer Price Index (CUUR0000SA0)
FAQ
What inflation rate should I use? Many planners use 2–3% for long-term averages, but you can test higher rates to be conservative.
Does this include investment returns? No — it isolates the effect of inflation on your income need. Your savings and returns should be planned separately to fund this target.
Is this currency-specific? No. The math works for any currency; just keep your inputs in one currency.