What Is a Revenue Calculator?
A revenue calculator determines the total gross income a business earns from selling a product or service. Revenue—also called sales or turnover—is the top line of an income statement, before any costs or expenses are subtracted. It is the foundation of profitability analysis, budgeting, and growth forecasting.
How to Use It
Enter two values: the price per unit (how much one item sells for) and the quantity sold (the number of units sold in the period). The calculator multiplies them and shows your total revenue. Use it for a single product line, a sales day, or a full quarter—just keep the price and quantity in matching units.
The Formula Explained
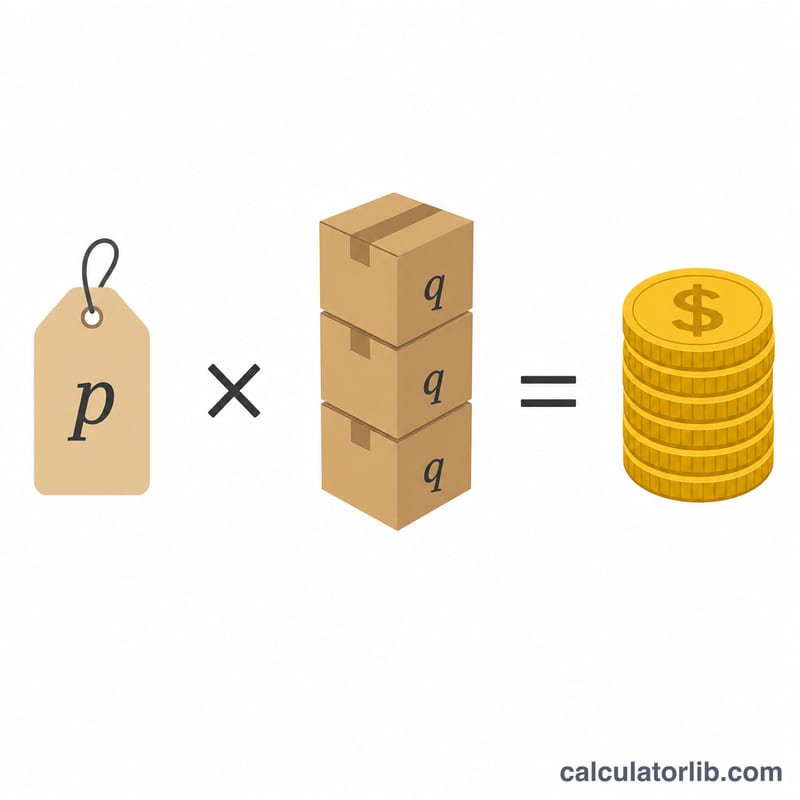
The core equation is simply:
$$\text{Revenue} = \text{Price} \times \text{Quantity Sold}$$
If you sell multiple products, calculate revenue for each line separately and add the results together for total company revenue. Note that revenue is not profit: to find profit you must subtract the cost of goods sold and operating expenses from revenue.
Worked Example
Suppose a coffee shop sells lattes at $4.50 each and sells 320 lattes in a week. $$\text{Revenue} = \$4.50 \times 320 = \$1{,}440$$ If the price rose to $5.00 with the same volume, revenue would climb to $1,600—a $160 increase from a $0.50 price change.
Revenue Across Price and Volume Scenarios
Revenue is the product of just two inputs, so every scenario below is the same arithmetic: \(\text{Revenue} = \text{Price per Unit} \times \text{Quantity Sold}\). What changes is how a move in one input interacts with a move in the other. The first four rows follow one small coffee shop over a single day (baseline: 320 cups at $4.50); the last two rows show the same formula applied to a subscription business and a service business, where the "unit" is a monthly subscription or a billable hour rather than a physical item.
| Scenario | Price per Unit | Quantity Sold | Revenue (Price × Quantity) | Change vs. Baseline |
|---|---|---|---|---|
| Coffee shop — baseline day | $4.50 | 320 cups | $1,440.00 | — |
| 10% price increase, volume holds | $4.95 | 320 cups | $1,584.00 | +$144.00 (+10.0%) |
| 10% price increase, 8% of volume lost | $4.95 | 294 cups | $1,455.30 | +$15.30 (+1.1%) |
| 10% discount, 25% volume gain | $4.05 | 400 cups | $1,620.00 | +$180.00 (+12.5%) |
| SaaS — monthly subscriptions | $29.00 / month | 150 subscribers | $4,350.00 | Different business — not comparable |
| Consulting — billable hours | $120.00 / hour | 85 hours | $10,200.00 | Different business — not comparable |
Compare rows 2, 3 and 4. Raising price by 10% adds the full 10% to revenue only if quantity does not move; once 8% of the cups are lost, almost all of that gain disappears and revenue rises just 1.1%. Row 4 is the mirror image: price per unit falls by 10%, yet revenue is the highest of the four coffee-shop rows, because the 25% increase in units more than offsets the lower price:
$$4.05 \times 400 = \$1{,}620.00 \quad \text{vs.} \quad 4.50 \times 320 = \$1{,}440.00$$The lesson is mechanical rather than strategic: a revenue change is the combined effect of both inputs, and the sign of the change in price alone tells you nothing about the sign of the change in revenue. Note also that row 4 sells 80 more cups than the baseline, so it carries more cost of goods and more labour — revenue says nothing about whether the extra $180 is worth it.
Key Revenue Terms Defined
These terms follow general accounting usage. Where a term is regional, that is noted.
- Revenue
- Gross income earned from selling goods or services, measured before any deduction for costs, discounts or taxes. This calculator's output is a revenue figure.
- Gross revenue / gross sales
- The total of price × quantity across all sales in the period, with nothing subtracted. Equivalent to the result this calculator produces for a single price-and-quantity pair.
- Net revenue / net sales
- Gross revenue minus sales discounts, allowances (price concessions granted after the sale) and the value of returned goods. Net revenue is usually the figure reported as the headline "revenue" line by public companies.
- Turnover
- The common term for revenue in the United Kingdom, Ireland and much of Europe. "Annual turnover" and "annual revenue" mean the same thing. (Confusingly, in US usage "turnover" more often refers to inventory turnover or staff turnover, so the context matters.)
- Top line
- An informal name for revenue, from its position as the first line of the income statement. "Top-line growth" means revenue growth, as opposed to "bottom-line" growth in net income.
- Price per unit
- The amount charged to the customer for one unit, in the currency of the sale. For this calculator, enter the price actually charged — if you want gross revenue at list price, enter the list price; if you want revenue net of a standing discount, enter the discounted price.
- Quantity sold
- The number of units sold within the measured period. This is not the number produced, not the number held in inventory, and not necessarily the number shipped — only units whose sale occurred in the period.
- Unit
- Whatever is being counted and priced: a physical item, a kilogram, a billable hour, a session, a seat, a monthly subscription, or a contract. Price and quantity must refer to the same unit for the product to be meaningful.
- COGS (cost of goods sold)
- The direct costs attributable to the goods or services sold in the period — materials, direct labour, and directly attributable production costs. COGS appears immediately below revenue on the income statement and is excluded from the revenue figure.
- Gross profit
- Revenue minus COGS: \(\text{Gross Profit} = \text{Revenue} - \text{COGS}\). Expressed as a percentage of revenue it is the gross margin.
- Average revenue per unit (ARPU)
- Total revenue divided by the number of units, or in subscription businesses by the number of customers or accounts: \(\text{ARPU} = \text{Revenue} \div \text{Quantity}\). With a single price, ARPU equals that price; with a mix of prices it is the blended average.
- Recurring revenue
- Revenue contracted to repeat on a schedule, typically summarised as MRR (monthly recurring revenue) or ARR (annual recurring revenue, conventionally MRR × 12). The SaaS row in the table above is an MRR figure.
- Accrual recognition
- The standard accounting convention that revenue is recorded in the period in which it is earned — when the goods are delivered or the service performed — rather than when the cash arrives. Both IFRS and US GAAP work this way, so an invoice issued in one period and paid in the next is revenue in the earlier period.
- Deferred revenue
- Cash collected for goods or services not yet delivered. Under accrual recognition it is a liability on the balance sheet, not revenue, until the obligation is satisfied — a common situation with annual subscriptions paid up front.
Interpreting Your Revenue Figure
The number returned is gross revenue for exactly the price and quantity you entered, over whatever period that quantity covers. It is the top line of an income statement: every other line sits beneath it. A conventional ordering runs revenue, then COGS, then gross profit, then operating expenses, then operating income, then interest and tax, then net income. Your figure is the starting point of that sequence, not a result of it.
What the figure excludes by construction
Because the calculation is a single multiplication, several things are necessarily absent:
- Discounts, returns and allowances. The output is gross, not net. If a tenth of the units came back, the revenue figure does not know it.
- Sales tax and VAT/GST collected from customers. Under standard accounting these amounts are collected on behalf of a tax authority and are a liability, not revenue. If your price per unit was tax-inclusive, the result overstates revenue by the tax component.
- Shipping, handling and other charges billed separately from the unit price. Whether these count as revenue depends on the arrangement and on applicable accounting rules; they are not in this figure unless you built them into the price.
- All costs. No materials, labour, fees, platform commissions, refunds or overhead have been deducted.
It is not a cash figure
Under accrual accounting, revenue is recognised when the performance obligation is satisfied — the goods are delivered or the service is performed — which can be earlier or later than the date the money moves. Credit sales, invoices on 30-day terms, and subscriptions prepaid for a year all break the link between revenue and cash received in the same period. Treat this result as an earnings measure for the period, not as a statement of what is in the bank.
Readings you can derive from it
- Average selling price. Reversing the formula, \(\text{Revenue} \div \text{Quantity} = \text{Average Selling Price}\). With one uniform price this just returns your input; with a blended figure assembled from several price points it gives the average price actually realised per unit, which may be well below list.
- Period-over-period comparison. Comparing two revenue figures indicates growth only if the two periods are the same length and comparably composed. A 31-day month against a 28-day month, or a quarter containing a holiday peak against one that does not, produces a difference that is partly just calendar. Normalising to revenue per day or comparing the same period a year earlier removes some of that distortion.
- Revenue is blind to margin. Nothing in \(\text{Price} \times \text{Quantity}\) carries information about profitability. A large revenue figure is fully compatible with break-even, with a loss, or with a deeply negative gross margin if the unit price sits below unit cost. Equally, a smaller revenue figure can accompany a far healthier bottom line. Any statement about whether the business is doing well requires the cost side, which this calculation does not touch.
Two mechanical checks
First, confirm that price and quantity refer to the same unit and the same period — $29 per month multiplied by 150 subscribers is a monthly figure, and multiplying it by 12 to annualise assumes every subscriber stays for the full year. Second, if the quantity you entered came from a shipping or production report rather than a sales report, the result may describe units moved rather than units sold.
This section explains what the number does and does not measure. It is general information about an accounting quantity, not accounting, tax or financial advice, and it offers no view on pricing, volume or any other decision; for treatment specific to your jurisdiction and circumstances, consult a qualified accountant.
FAQ
Is revenue the same as profit? No. Revenue is total sales income; profit is what remains after subtracting all costs.
Should I use gross or net price? Use the actual selling price your customers pay. If you want net revenue, deduct discounts and returns from the quantity or price first.
Can I use this for services? Yes. Treat the service rate as the "price" and the number of sessions, hours, or contracts as the "quantity."