
What Is the Break-Even Point?
The break-even point (BEP) is the level of sales at which total revenue exactly equals total costs, so your business makes neither a profit nor a loss. Measured in units, it tells you exactly how many products you must sell before every additional sale starts generating profit. It is one of the most important figures in cost-volume-profit (CVP) analysis and is widely used in pricing, budgeting, and startup planning.
How to Use This Calculator
Enter three numbers: your total fixed costs (rent, salaries, insurance — costs that don't change with volume), the selling price per unit, and the variable cost per unit (materials, packaging, per-unit labour). The calculator returns the break-even quantity, the contribution margin per unit, and the revenue you'll generate at that point.
The Formula Explained
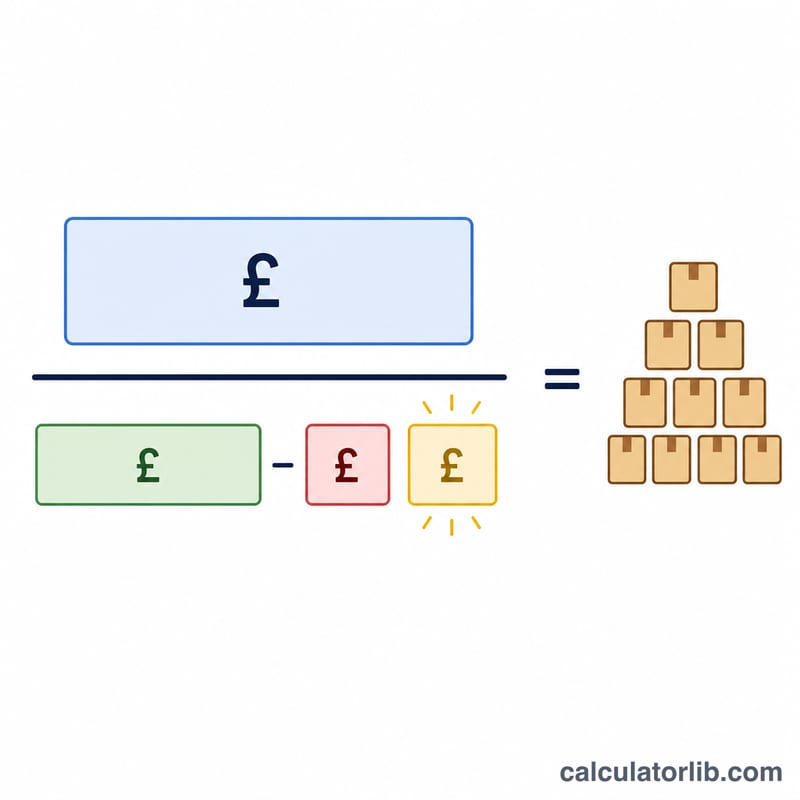
The core formula is Break-Even Units = Fixed Costs ÷ (Price per Unit − Variable Cost per Unit). The denominator, price minus variable cost, is called the contribution margin — the amount each unit sold contributes toward covering fixed costs. Once total contribution equals fixed costs, you've broken even.
Worked Example
Suppose fixed costs are $10,000, the price per unit is $25, and the variable cost per unit is $15. The contribution margin is $25 − $15 = $10. Break-even units = $10,000 ÷ $10 = 1,000 units. At $25 each, that's $25,000 in break-even revenue.
Interpreting Your Result
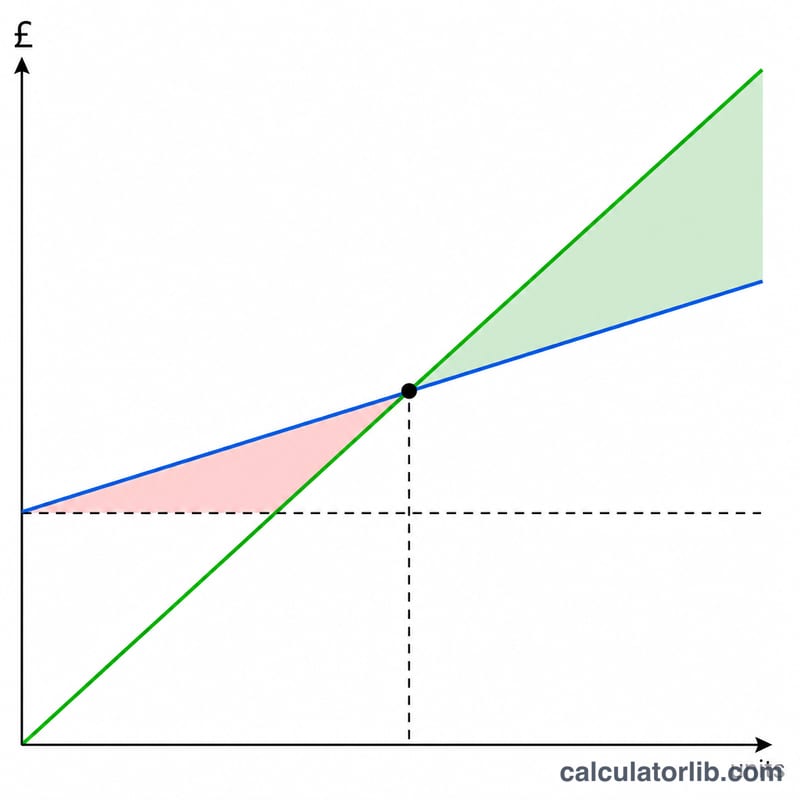
Your break-even quantity is the sales volume at which profit is exactly zero — total revenue equals total cost. Reading the result correctly depends on understanding what happens on each side of that point.
- Below break-even: You sell fewer units than the break-even quantity, so contribution margin does not fully cover fixed costs and the business operates at a loss. The shortfall equals the unsold units times the contribution margin per unit.
- At break-even: Revenue exactly covers all fixed and variable costs; net operating profit is zero.
- Above break-even: Every additional unit sold adds its full contribution margin straight to profit, because fixed costs are already covered. If your break-even is 334 units and you sell 400, the extra 66 units at a $30 margin produce \(66 \times \$30 = \$1{,}980\) of operating profit.
This relationship is the core of cost-volume-profit (CVP) analysis, which assumes that within the relevant range, selling price, variable cost per unit, and total fixed costs remain constant and that volume is the main driver of profit.
High vs. low break-even. A high break-even point usually signals a business with large fixed costs relative to its contribution margin — common in capital-intensive operations. Such businesses have high operating leverage: profits rise sharply once volume passes break-even, but losses mount quickly if sales fall short. A low break-even point indicates a leaner fixed-cost structure or a generous contribution margin, making the business more resilient to downturns in demand.
Margin of safety. The gap between your actual or expected sales and the break-even point is your margin of safety — the cushion before you slip into a loss. A larger margin of safety means demand can decline substantially before profitability is threatened, while a thin margin leaves little room for error.
To reduce your break-even point you can lower fixed costs, raise the selling price, or reduce variable cost per unit (each of which widens the contribution margin). Comparing scenarios before committing to pricing or cost changes shows how sensitive your required volume is to each lever.
This is general educational information about break-even and CVP analysis, not financial advice. Real costs may be mixed, step up at higher volumes, or change over time; consult a qualified professional for decisions specific to your business.
FAQ
What if price is below variable cost? Then the contribution margin is zero or negative and you can never break even — every sale loses money. The calculator returns zero in that case.
Should I include taxes? The basic model ignores taxes since you pay no income tax at zero profit. For after-tax targets, use a target-profit version of the formula.
What's the difference between break-even units and break-even revenue? Units is a quantity; revenue is that quantity multiplied by price — the dollar sales needed to break even.