What Is Root Mean Square Error (RMSE)?
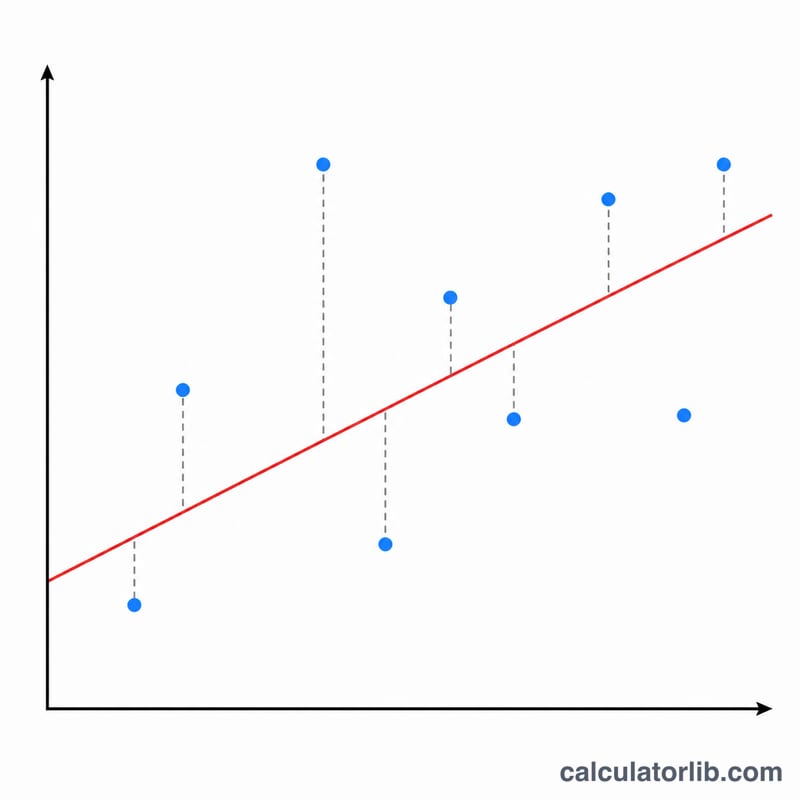
Root Mean Square Error (RMSE) is one of the most widely used metrics for measuring how far a model's predictions deviate from the observed (actual) values. It expresses the typical size of the prediction error in the same units as the data, which makes it easy to interpret. A lower RMSE means a better fit, and an RMSE of zero means the predictions are perfect.
How to Use This Calculator
Enter your actual values and your predicted values as two lists, separated by commas or spaces. The two lists should have the same number of entries; if they differ, the calculator uses the first n matching pairs. Click calculate to see the RMSE, along with the Mean Squared Error (MSE) and Mean Absolute Error (MAE) for additional context.
The Formula Explained
RMSE is computed in four steps: (1) subtract each predicted value from its actual value to get the error, (2) square each error so positive and negative values do not cancel, (3) average those squared errors to get the MSE, and (4) take the square root to return to the original units. Squaring gives larger errors more weight, so RMSE is sensitive to outliers compared with MAE.
$$\text{RMSE} = \sqrt{\frac{1}{n} \sum_{i=1}^{n} \left( \text{Actual}_i - \text{Predicted}_i \right)^2}$$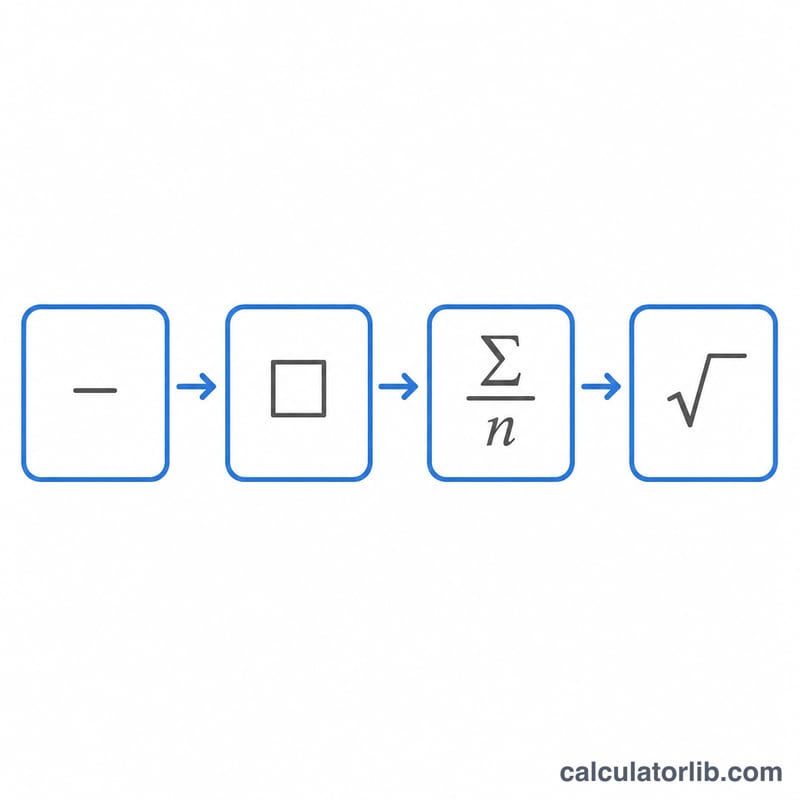
Worked Example
Suppose actual = [3, -0.5, 2, 7] and predicted = [2.5, 0.0, 2, 8]. The errors are 0.5, -0.5, 0, -1. Squared: 0.25, 0.25, 0, 1, which sum to 1.5. Dividing by \(n = 4\) gives \(\text{MSE} = 0.375\). The square root gives \(\text{RMSE} \approx 0.6124\). The MAE is $$\text{MAE} = \frac{0.5 + 0.5 + 0 + 1}{4} = 0.5.$$
FAQ
What is a good RMSE value? It depends entirely on the scale of your data. Compare RMSE to the range or mean of your target variable, or against a baseline model.
How is RMSE different from MAE? RMSE squares errors before averaging, so it penalizes large errors more heavily, while MAE treats all errors proportionally.
Can RMSE be negative? No. Because it is the square root of an average of squares, RMSE is always zero or positive.