What this calculator tells you
Given a pot of savings, a fixed monthly withdrawal, and an assumed rate of return, this tool answers one question: how long before the money runs out. It reports the answer as years and months (or as a bare month count for short horizons), and it adds a schedule of alternative withdrawal amounts — what you could take each month if you wanted the balance to last 5, 10, 20 years instead.
People reach for it where a lump sum has to become an income: at retirement, after a severance or inheritance, or when deciding whether a bridge fund can carry them to the age at which Social Security or a pension begins. If your withdrawal is small enough that returns cover it, the tool says so and stops — the balance never falls.
How to read the three inputs
All three are numbers, and all three matter to the cent. Commas are fine.
| Input | Where the value comes from | Sensible range |
|---|---|---|
| Current savings | The total of the accounts you actually intend to draw down — brokerage, IRA, 401(k) — from your latest statements. Leave out the house and anything you will not liquidate. | $50,000 – $5,000,000 |
| Monthly withdrawal | Your monthly spending minus the income you already have coming in (Social Security, pension, annuity, rent). This is the gap the savings must fill, not your whole budget. | $1,000 – $15,000 |
| Average investment return | The annual return you expect on the balance while you are drawing it down, after fees. Retirement-stage portfolios are usually more conservative than accumulation-stage ones. | 2% – 8%; negatives are allowed, down to just above −100% |
The return is an annual figure, treated as an effective annual rate — see the formula below. For an answer in today's purchasing power, enter a return net of inflation (a 6% portfolio with 3% inflation is roughly 3% real) rather than adjusting the withdrawal.
The formula
Write \(P\) = current savings, \(W\) = monthly withdrawal, \(r\) = annual return in percent. The monthly rate \(i\) is the annual rate de-compounded — the rate that, compounded twelve times, gives exactly \(1+r\):
$$i = \left(1 + \frac{r}{100}\right)^{1/12} - 1$$Withdrawals are taken at the end of each month, so the number of months \(n\) the balance survives is the ordinary-annuity solution:
$$n = \frac{-\ln\!\left(1 - \dfrac{P \times i}{W}\right)}{\ln(1+i)} \qquad\text{(and } n = \frac{P}{W} \text{ when } r = 0\text{)}$$The result is split with no rounding carried between the parts: \(Y=\lfloor n/12 \rfloor\) years and \(M = n - 12Y\) months, shown to one decimal. Each row of the schedule inverts the same relationship — the payment that exactly exhausts \(P\) over \(N\) months:
$$\text{pmt}(N) = \frac{P \times i}{1 - (1+i)^{-N}}$$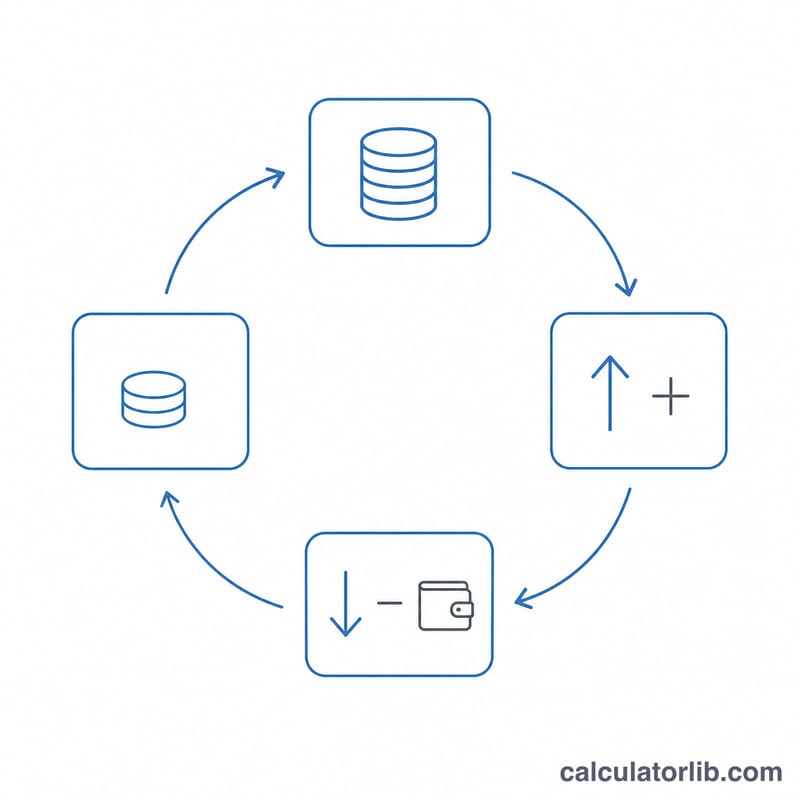
Worked example
Savings \(P = \$400{,}000\), withdrawal \(W = \$3{,}000\) per month, return \(r = 5\%\).
First the monthly rate, and one month's return on the untouched balance:
$$i = 1.05^{1/12} - 1 = 0.0040741238$$ $$P \times i = \$400{,}000 \times 0.0040741238 = \$1{,}629.65$$The withdrawal of \(\$3{,}000\) is larger than \(\$1{,}629.65\), so the balance does fall; and \(P > W\), so it lasts more than a month. The lifetime:
$$\frac{P \times i}{W} = \frac{1{,}629.65}{3{,}000} = 0.5432165$$ $$n = \frac{-\ln(1 - 0.5432165)}{\ln(1.0040741238)} = \frac{0.78354575}{0.0040658470} = 192.714 \text{ months}$$That splits into \(Y = \lfloor 192.714/12 \rfloor = 16\) years and \(M = 192.714 - 192 = 0.7\) months — 16 years and 0.7 months. Because \(Y = 16\) falls in the 5-year-step band, the schedule runs in 5-year rows, \(\lfloor 16/5 \rfloor + 4 = 7\) of them. The first is
$$\text{pmt}(60) = \frac{\$1{,}629.65}{1 - 1.0040741238^{-60}} = \frac{\$1{,}629.65}{0.216475} = \$7{,}528.16$$| Money to last | Monthly withdrawal |
|---|---|
| 5 years | $7,528.16 |
| 10 years | $4,220.94 |
| 15 years | $3,140.08 |
| 20 years | $2,615.35 |
| 25 years | $2,312.55 |
| 30 years | $2,120.22 |
| 35 years | $1,990.51 |
Rules that surprise people
The return is compounded, not divided. A 5% return does not become 0.4167% a month here; it becomes 0.40741%, the rate whose twelfth power is 1.05. Dividing by twelve would have said 16 years and 3.0 months instead of 16 years and 0.7 months, and $7,548.49 instead of $7,528.16 on the 5-year row — always in the flattering direction, by roughly two months of retirement income.
"Infinitely" is decided by a single cent, and it is checked before anything else. If your withdrawal is less than or equal to one month's return on the current balance, the tool reports that you can withdraw that amount forever and shows no schedule. On $600,000 at 6%, one month's return is $2,920.53: withdrawing $2,920.53 gives "infinitely", withdrawing $2,920.54 gives 216 years and 6.8 months with a 26-row table. The threshold uses the exact figure, not the rounded $2,921 you see printed.
"Less than 1 month" is a comparison, not a calculation. If your savings are at or below one month's withdrawal, you get that message and nothing else — even when the arithmetic disagrees. $600,000 with a $600,000 monthly withdrawal at 6% would last 1.005 months, but prints "less than 1 month"; add one dollar to the savings and you get a month count and a table. Entering 0 savings lands here too.
The schedule is not a fixed 5-to-35-year grid. Both its spacing and its length depend on how many whole years your money lasts, in four bands:
| Your answer | Row spacing | Rows shown |
|---|---|---|
| 0–5 years | 1 year | \(\lfloor Y/1 \rfloor + 5\) |
| 6–10 years | 2 years | \(\lfloor Y/2 \rfloor + 5\) |
| 11–30 years | 5 years | \(\lfloor Y/5 \rfloor + 4\) |
| Over 30 years | 10 years | \(\lfloor Y/10 \rfloor + 5\) |
One consequence looks like a bug and is not: at 10 years the table has 10 rows reaching 20 years, and at 11 years it has 6 rows stopping at 30. The table gets shorter as the money lasts longer.
The schedule answers the opposite question. Its rows are not projections of your balance. Each says: to make this same starting balance last that many years, here is what you could withdraw monthly. That is why rows run past your own answer — above, the money lasts 16 years and the table still lists 20, 25, 30 and 35.
The months never roll up into the years. The two parts are computed separately, so the tool will happily print "1 years and 12.0 months" rather than 2 years — for instance $23,950 withdrawn at $1,000 a month with no return.
Cents count in the maths, dollars in the sentence. A withdrawal of $1,234.56 is echoed as $1,235 in the headline, but the whole calculation uses $1,234.56. From $600,000 at 1% that is 51 years and 10.4 months; using the rounded $1,235 would give 10.1 months. Don't round your inputs before typing them.
Very negative returns produce $0.00 rows. At −99% a year, the balance evaporates faster than any withdrawal can drain it, so the longer schedule rows round to zero. Those rows are honest, not broken.
Common questions
Does this account for inflation or taxes?
No. The withdrawal is held flat for the whole period and the return is applied gross. To think in today's dollars, enter a return net of inflation; for taxes, raise the withdrawal to cover the expected bill on money coming out of tax-deferred accounts.
What return should I enter?
Whatever your drawdown portfolio is likely to earn, not what it earned during accumulation. A balanced retirement mix is commonly assumed at 4–6% nominal. Because the figure is annual-effective, entering 6% means the balance grows by exactly 6% over twelve months — not 0.5% twelve times.
Why does it say my money lasts forever?
Because your withdrawal is at or below one month's return on the balance, so the balance never declines. That threshold is one month's return on the amount you entered — it shifts the moment your balance or your assumed rate changes, so treat it as a knife edge rather than a guarantee.
Is a 0% return handled correctly?
Yes, and exactly rather than approximately. At 0% the answer is simply savings divided by withdrawal: $23,000 at $1,000 a month reports 23.0 months.
Why did my answer switch from "months" to "years and months"?
The headline stays in plain months up to and including 23 months, and switches to the years form above that. So 23.0 months prints as months, and 23.1 prints as 1 year and 11.1 months.
How Long the Money Lasts: Scenario Comparison
The table below holds the starting pot fixed at $500,000 and varies the fixed monthly withdrawal and the annual rate of return. Every cell is computed with the same end-of-month (ordinary annuity) model this calculator uses:
$$N = -\frac{\ln\left(1 - \dfrac{i \cdot P}{W}\right)}{\ln(1+i)}, \qquad i = \left(1 + \frac{r}{100}\right)^{1/12} - 1$$where \(N\) is the number of monthly withdrawals, \(P\) the starting savings, \(W\) the monthly withdrawal and \(i\) the effective monthly rate. Durations are shown as whole years and months; returns are assumed constant, and taxes, fees and inflation are excluded.
| Monthly withdrawal | 0% return | 3% return | 5% return | 7% return |
|---|---|---|---|---|
| $2,000 | 20 years 10 months | 32 years 5 months | Never depletes | Never depletes |
| $3,000 | 13 years 10 months | 17 years 10 months | 23 years 3 months | 42 years 2 months |
| $4,000 | 10 years 5 months | 12 years 5 months | 14 years 7 months | 18 years 1 month |
| $5,000 | 8 years 4 months | 9 years 6 months | 10 years 8 months | 12 years 3 months |
Reading the "never depletes" cells. The balance only runs down when the withdrawal exceeds the interest the pot earns in a month, i.e. when \(W > P \cdot i\). At 5% the monthly rate is \(i = 1.05^{1/12} - 1 = 0.0040741\), so a $500,000 pot earns \(500{,}000 \times 0.0040741 = \$2{,}037.06\) in its first month — more than a $2,000 withdrawal, so the balance grows instead of shrinking and the logarithm in the formula is undefined. At 7% the same pot earns about $2,827 in month one, comfortably covering $2,000.
The relationship is strongly non-linear. At 5%, drawing $4,000 a month exhausts $500,000 in about 14 years 7 months, but halving the draw to $2,000 does not merely double the horizon — it removes the end date entirely, because the withdrawal drops below the earnings threshold. Even short of that threshold the curve bends sharply: at 5%, $5,000 a month lasts 10 years 8 months while $3,000 a month lasts 23 years 3 months, more than twice as long for a 40% smaller draw. Each dollar you do not withdraw stays invested and keeps compounding, so small reductions near the sustainable-withdrawal boundary buy disproportionately large amounts of time.
Sample substitution for the $3,000 / 5% cell: \(i = 0.0040741\), \(i \cdot P / W = 0.0040741 \times 500{,}000 / 3{,}000 = 0.67902\), so \(N = -\ln(1 - 0.67902) / \ln(1.0040741) = 1.13638 / 0.0040658 = 279.5\) months = 23 years 3 months.
Interpreting Your Result
The number this calculator returns is a smooth-average projection, not a probability or a forecast. The model assumes three things hold perfectly for the entire horizon: a constant nominal rate of return every single month, a constant nominal withdrawal every single month, and a withdrawal taken at the end of each month after that month's return is credited. Nothing in the arithmetic varies, so the answer tells you what happens in the one specific world where your assumptions are exactly true — it does not tell you how likely that world is.
Why identical average returns can give different outcomes
Real portfolios do not deliver the same return every month, and the order of returns matters once you are withdrawing. Two portfolios can average the same annual return over 20 years and still run dry at different times: the one that suffers its losses early sells more units at depressed prices to fund the same fixed withdrawal, permanently shrinking the base that later gains can compound on. This is called sequence-of-returns risk, and it is invisible to a constant-rate formula. Treat the calculator's figure as a central reference point, and expect a real-world range around it that widens with a more volatile asset mix.
What the figure excludes
- Taxes. The withdrawal you enter is treated as a gross amount leaving the account, with no tax deducted. In the United States, distributions from a traditional IRA or 401(k) are generally taxable as ordinary income, while qualified Roth distributions are generally not taxed; taxable brokerage withdrawals may trigger capital gains. If your withdrawal must cover a tax bill as well as spending, enter the pre-tax amount you actually need to remove, not your target take-home. Tax treatment differs by country — check the rules that apply where you are resident.
- Mandated withdrawals. Several jurisdictions force distributions from tax-deferred accounts at a certain age (in the US these are required minimum distributions, or RMDs). A mandated withdrawal larger than the amount you entered will shorten the horizon shown here.
- Fees, inflation adjustments and variable spending. Fund expense ratios and advice fees reduce your effective return, so enter a net-of-fee figure if you want the result to reflect them. A withdrawal that you raise each year with prices is not modelled by a fixed \(W\).
Nominal years versus purchasing-power years
What you enter for the return determines what the answer means. Enter a nominal return (the headline figure your portfolio is expected to earn) and the result is a nominal-dollar horizon: the money lasts that long, but each later withdrawal buys less. Enter a real return — approximately the nominal return minus the inflation rate, or precisely \(r_{real} = \frac{1+r_{nom}}{1+\pi} - 1\) — and the result is a purchasing-power horizon: the money lasts that long while every withdrawal keeps today's buying power. The real-return version is the more conservative reading and usually the more useful one for a multi-decade plan.
Reading the "never runs out" case
When the calculator reports that the savings never deplete, it has detected that the withdrawal is fully funded by returns. Formally, the balance is non-decreasing whenever
$$P \cdot i \ge W \qquad \text{equivalently} \qquad W \le P\left[\left(1+\tfrac{r}{100}\right)^{1/12} - 1\right]$$At that boundary the pot behaves like a perpetuity: interest exactly replaces the cash taken out. Above it the balance grows; below it, no matter how slowly, depletion is eventually certain. Because the condition depends on a constant return, it is a mathematical statement about your inputs, not a guarantee — a run of poor years pushes a real portfolio below the threshold even if the long-run average sits above it.
This section is general information about how the calculation works, not financial or tax advice. Individual circumstances, tax rules and account types vary; consult a qualified professional before acting on any drawdown plan.
Key Terms Used in This Calculator
- Current savings (\(P\))
- The starting balance available for drawdown — only the money you are actually willing to spend down. Emergency reserves, a property you intend to keep, or funds earmarked for something else should be excluded, because the formula assumes the whole of \(P\) is consumed.
- Monthly withdrawal (\(W\))
- The fixed gross amount removed at the end of each month. In retirement planning this is typically the income gap: your monthly spending minus any guaranteed income such as a state or workplace pension, an annuity, or continuing part-time earnings. It is the shortfall the savings must cover, not your total budget.
- Annual return (\(r\))
- The yearly growth rate assumed for the invested balance, entered as a percentage. It should be net of investment fees, and it is applied identically to every month of the projection.
- Monthly rate (\(i\))
- The rate actually applied each month, defined as \(i = (1 + r/100)^{1/12} - 1\). The twelfth root is used because compounding twelve times must reproduce the stated annual return exactly: \((1+i)^{12} = 1 + r/100\). Dividing by twelve instead (\(r/12\)) ignores compounding within the year and overstates the monthly rate — at \(r = 6\%\), \(r/12 = 0.5000\%\) but the correct \(i = 0.4868\%\), which compounds to 6.17% a year rather than 6%.
- Effective annual rate versus nominal APR
- A nominal annual rate quoted with a compounding frequency (for example "6% compounded monthly") is a simple sum of periodic rates; the effective annual rate is what you truly earn once compounding is included (6% compounded monthly = 6.17% effective). This calculator treats the rate you enter as an effective annual rate and converts it downward with the twelfth root, so entering 6% means the balance genuinely grows 6% per year.
- Ordinary annuity versus annuity-due
- An ordinary annuity pays at the end of each period; an annuity-due pays at the beginning. This tool models an ordinary annuity — the month's return is credited first, then the withdrawal is taken. Beginning-of-month withdrawals give each dollar one less month of growth, so an annuity-due depletes marginally sooner; the gap is small at low rates but grows with the return and the horizon.
- Drawdown (decumulation)
- The phase in which you spend a portfolio down rather than adding to it — the mirror image of accumulation. Because contributions have stopped, the portfolio can no longer recover from losses by buying in at lower prices, which is what makes withdrawal-phase risk behave differently from saving-phase risk.
- Nominal versus real return
- A nominal return is the raw growth rate; a real return subtracts inflation and measures growth in purchasing power, \(r_{real} = \frac{1+r_{nom}}{1+\pi} - 1\), where \(\pi\) is the inflation rate. Feeding a real return into the calculator produces a horizon in inflation-adjusted years.
- Perpetuity / sustainable-withdrawal condition
- The point at which earnings alone cover the withdrawal, \(W \le P \cdot i\). At or below this level the balance never falls, and the pot behaves like a perpetuity paying \(W\) forever. The calculator reports this case instead of a duration.
- Sequence-of-returns risk
- The risk that poor returns arriving early in the withdrawal phase permanently damage a portfolio, even if the long-run average return is unchanged. Fixed withdrawals during a downturn liquidate more units at low prices, leaving a smaller base to recover with. Constant-rate models such as this one cannot capture it; probabilistic (Monte Carlo) or historical-sequence analysis is used for that purpose.