What is a Break-Even Calculator?
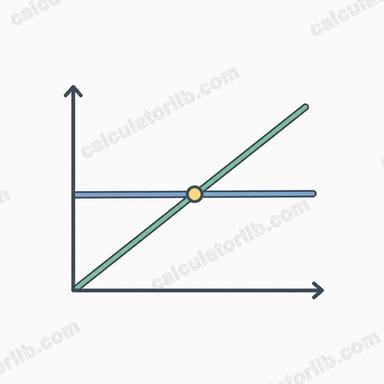
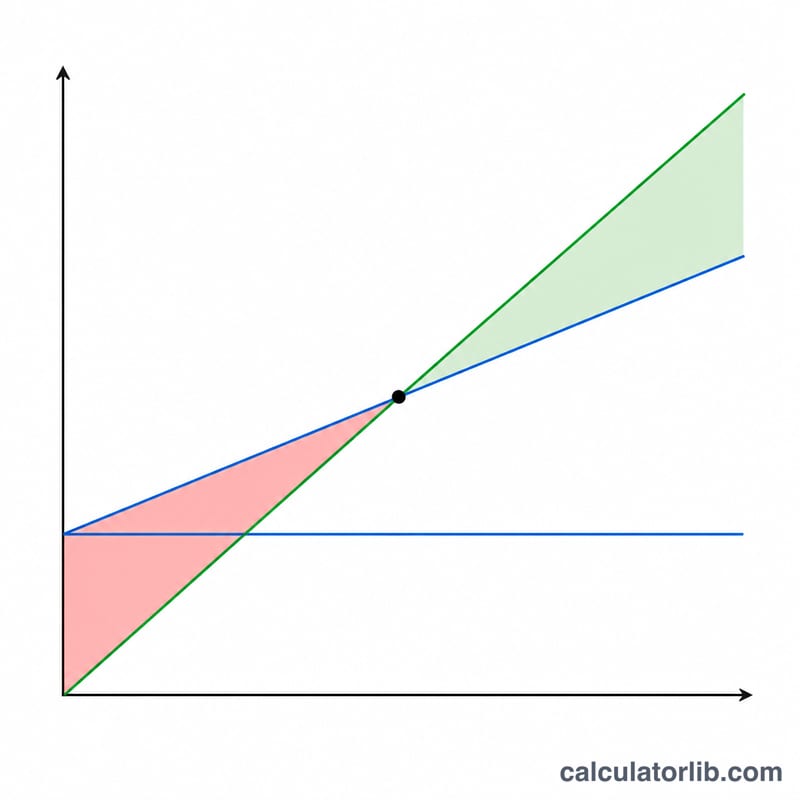
A break-even calculator is a financial tool that helps businesses determine the point at which total costs equal total revenue, resulting in neither profit nor loss. This critical threshold is known as the break-even point and is expressed in both units sold and sales revenue.
When to Use a Break-Even Calculator
- When launching a new product to determine how many units need to be sold to cover costs
- When evaluating the viability of a business project or investment
- When setting pricing strategies and analyzing how price changes affect the break-even point
How to Calculate Break-Even Point
The break-even point can be calculated using the following formulas:
Contribution Margin = Selling Price - Variable Costs per Unit
Contribution Margin Ratio = Contribution Margin / Selling Price
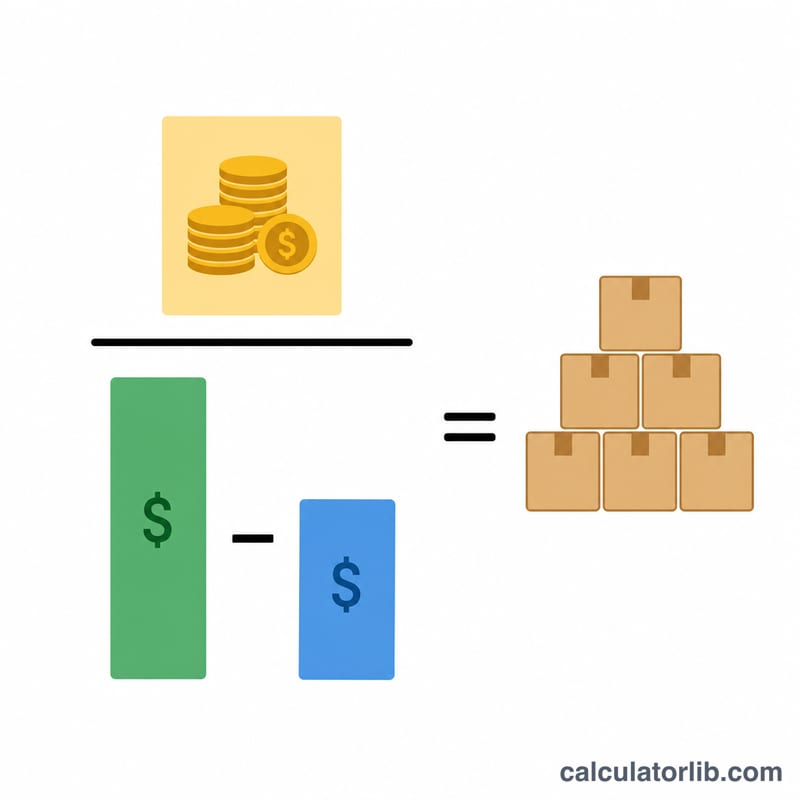
Break-Even Point (Units) = Fixed Costs / Contribution Margin
Break-Even Point (Sales) = Break-Even Units × Selling Price
Where:
- Fixed Costs: Expenses that remain constant regardless of production volume (rent, salaries, insurance, etc.)
- Variable Costs: Expenses that change with production volume (materials, direct labor, commissions, etc.)
- Selling Price: The price at which each unit is sold to customers
Calculation Examples
Example 1: Small Retail Business
A clothing store has monthly fixed costs of $5,000. Each t-shirt costs $8 to produce and sells for $20. How many t-shirts must be sold to break even?
| Input | Value |
|---|---|
| Fixed Costs | $5,000 |
| Variable Costs per Unit | $8 |
| Selling Price per Unit | $20 |
Calculation:
- Contribution Margin = $20 - $8 = $12 per unit
- Contribution Margin Ratio = $12 / $20 = 0.6 or 60%
- Break-Even Point (Units) = $5,000 / $12 = 416.67 units (rounded to 417 units)
- Break-Even Point (Sales) = 417 × $20 = $8,340
Example 2: Manufacturing Company
A furniture manufacturer has quarterly fixed costs of $75,000. Each chair costs $45 to produce and sells for $120. What is the break-even point?
| Input | Value |
|---|---|
| Fixed Costs | $75,000 |
| Variable Costs per Unit | $45 |
| Selling Price per Unit | $120 |
Calculation:
- Contribution Margin = $120 - $45 = $75 per unit
- Contribution Margin Ratio = $75 / $120 = 0.625 or 62.5%
- Break-Even Point (Units) = $75,000 / $75 = 1,000 units
- Break-Even Point (Sales) = 1,000 × $120 = $120,000
Example 3: Service Business
A consulting firm has annual fixed costs of $200,000. Each consultation has variable costs of $75 and the service is priced at $250. How many consultations are needed to break even?
| Input | Value |
|---|---|
| Fixed Costs | $200,000 |
| Variable Costs per Unit | $75 |
| Selling Price per Unit | $250 |
Calculation:
- Contribution Margin = $250 - $75 = $175 per consultation
- Contribution Margin Ratio = $175 / $250 = 0.7 or 70%
- Break-Even Point (Units) = $200,000 / $175 = 1,142.86 consultations (rounded to 1,143)
- Break-Even Point (Sales) = 1,143 × $250 = $285,750
Understanding Break-Even Analysis
Break-even analysis helps businesses make informed decisions about pricing, production volumes, and cost management. By knowing your break-even point, you can:
- Set realistic sales targets
- Evaluate the impact of changing prices or costs
- Understand how many units must be sold before making a profit
- Assess the financial risk of business decisions
Interpreting Your Break-Even Results
The calculator returns four related numbers. Each answers a different question about the same cost structure.
- Break-even units — the sales volume at which total revenue exactly equals total costs, so profit is zero: \( \text{BE units} = \frac{ {\text{Fixed Costs}}}{\text{Price} - \text{Variable Cost per Unit}} \).
- Break-even sales — the revenue generated at that volume, either as \( \text{BE units} \times \text{Price} \) or, equivalently, \( \text{BE sales} = \frac{ {\text{Fixed Costs}}}{\text{CM ratio}} \).
- Contribution margin (CM) — the money left from one unit after its own variable cost, available to cover fixed costs: \( \text{CM} = \text{Price} - \text{Variable Cost} \). Once fixed costs are fully covered, each further unit's CM becomes profit.
- CM ratio — the share of each sales dollar left after variable costs: \( \text{CM ratio} = \frac{ {\text{CM}}}{\text{Price}} \). A CM ratio of 0.60 means 60 cents of every revenue dollar goes toward fixed costs and profit.
Because break-even sales equal fixed costs divided by the CM ratio, a higher CM ratio always produces a lower break-even sales figure for the same fixed costs. Doubling the CM ratio halves the revenue you must generate before you stop losing money.
Worked example
Fixed costs of $12,000 per month, a variable cost of $30 per unit and a price of $50 per unit give:
$$\text{CM} = \$50 - \$30 = \$20 \qquad \text{CM ratio} = \frac{\$20}{\$50} = 0.40$$
$$\text{BE units} = \frac{\$12{,}000}{\$20} = 600 \text{ units} \qquad \text{BE sales} = \frac{\$12{,}000}{0.40} = \$30{,}000$$
So the business must sell 600 units, or $30,000 of revenue, each month to break even.
Rounding, and when break-even does not exist
Break-even units should be rounded up to the next whole unit whenever you sell indivisible items. If the formula returns 416.67 units, selling 416 units still leaves a small slice of fixed cost uncovered, so 417 is the first whole volume at which the business is not at a loss. (Rounding up makes reported break-even sales at that whole unit count slightly higher than the exact fixed-costs ÷ CM-ratio figure.)
If price is equal to or lower than variable cost per unit, the contribution margin is zero or negative and break-even is mathematically undefined: every additional unit sold contributes nothing — or actively loses money — so no volume, however large, covers the fixed costs. The only fixes are raising price, cutting variable cost, or discontinuing the product.
Margin of safety
Once you know break-even sales, compare it with your actual or forecast sales:
$$\text{Margin of Safety} = \frac{\text{Actual Sales} - \text{Break-Even Sales}}{\text{Actual Sales}}$$
Actual sales of $40,000 against break-even sales of $30,000 give a margin of safety of \( (40{,}000 - 30{,}000) / 40{,}000 = 25\% \) — revenue could fall by a quarter before the operation moves into a loss.
Assumptions behind the model
Cost-volume-profit analysis is a simplification. It assumes a constant selling price at every volume (no discounts for bulk orders), a variable cost per unit that stays linear as output changes, and fixed costs that remain fixed only within the relevant range of activity — hiring a second shift or renting a second unit shifts fixed costs to a new level and gives you a new break-even point. It also assumes everything produced is sold, so inventory changes are ignored.
Finally, keep the period consistent: if you enter monthly fixed costs, the answer is a monthly break-even volume; annual fixed costs give an annual figure. Mixing an annual rent figure with a monthly sales target is the most common source of a wrong answer.
This section explains the arithmetic only and is general information, not investment, accounting or business advice.
Break-Even Under Different Price and Cost Scenarios
The table below starts from a baseline of $5,000 fixed costs, $8 variable cost per unit and a $20 selling price, then varies one input at a time. Contribution margin is price minus variable cost; CM ratio is CM divided by price; break-even units are rounded up to the next whole unit; break-even sales are fixed costs divided by the CM ratio.
| Scenario | Fixed costs | Variable cost/unit | Price | Contribution margin | CM ratio | Break-even units | Break-even sales |
|---|---|---|---|---|---|---|---|
| Baseline | $5,000 | $8 | $20 | $12 | 60.0% | 417 | $8,333.33 |
| Price $18 | $5,000 | $8 | $18 | $10 | 55.6% | 500 | $9,000.00 |
| Price $22 | $5,000 | $8 | $22 | $14 | 63.6% | 358 | $7,857.14 |
| Price $25 | $5,000 | $8 | $25 | $17 | 68.0% | 295 | $7,352.94 |
| Variable cost $6 | $5,000 | $6 | $20 | $14 | 70.0% | 358 | $7,142.86 |
| Variable cost $10 | $5,000 | $10 | $20 | $10 | 50.0% | 500 | $10,000.00 |
| Variable cost $12 | $5,000 | $12 | $20 | $8 | 40.0% | 625 | $12,500.00 |
| Fixed costs $4,000 | $4,000 | $8 | $20 | $12 | 60.0% | 334 | $6,666.67 |
| Fixed costs $7,500 | $7,500 | $8 | $20 | $12 | 60.0% | 625 | $12,500.00 |
| Fixed costs $10,000 | $10,000 | $8 | $20 | $12 | 60.0% | 834 | $16,666.67 |
Two patterns stand out. Break-even units move in direct proportion to fixed costs — doubling fixed costs from $5,000 to $10,000 doubles the required volume — while price and variable cost act on the denominator, so small changes there swing the answer sharply once the margin is thin.
Note: a 10% price increase always lowers break-even volume more than a 10% cut in variable cost, and the gap widens as the margin narrows. Raising price by 10% adds \( 0.10 \times \text{Price} \) to the contribution margin, whereas cutting variable cost by 10% adds only \( 0.10 \times \text{Variable Cost} \) — and price exceeds variable cost in any viable product. With a $20 price and an $18 variable cost (CM of $2), a 10% price rise takes CM to $4 and halves break-even volume, while a 10% variable-cost cut takes CM only to $3.80, reducing volume by about 47%. Whether the market will accept the higher price is a separate question the arithmetic cannot answer.
Key Terms and Definitions
- Fixed costs
- Costs that do not change with output over the relevant range — rent, insurance, salaried staff, software subscriptions, depreciation. They are incurred even at zero units sold and form the numerator of the break-even formula.
- Variable cost per unit
- Cost incurred for each additional unit produced or sold — materials, packaging, per-unit shipping, sales commission, payment-processing fees. Total variable cost is \( \text{Variable Cost per Unit} \times \text{Units} \).
- Semi-variable (mixed) costs
- Costs with both a fixed and a variable component, such as a utility bill with a standing charge plus usage, or a wage with base pay plus overtime. Before using this calculator, split them: \( \text{Total Cost} = \text{Fixed Component} + (\text{Variable Rate} \times \text{Units}) \), then add each part to the correct input.
- Selling price
- Revenue received per unit, net of discounts and returns. If your reported prices include a sales tax or VAT that you remit to a tax authority, use the net-of-tax price, since that tax is not your revenue.
- Contribution margin (CM)
- \( \text{CM} = \text{Price} - \text{Variable Cost per Unit} \). The amount each unit contributes toward fixed costs and, beyond break-even, toward profit.
- Contribution margin ratio
- \( \text{CM ratio} = \frac{ {\text{CM}}}{\text{Price}} \), the fraction of each sales dollar remaining after variable costs. Useful when you think in revenue rather than units.
- Break-even point in units
- \( \frac{ {\text{Fixed Costs}}}{\text{CM}} \) — the volume at which profit is exactly zero. Round up to the next whole unit for indivisible products.
- Break-even point in sales
- \( \frac{ {\text{Fixed Costs}}}{\text{CM ratio}} \), or equivalently break-even units multiplied by price. The revenue figure at which the business neither profits nor loses.
- Margin of safety
- \( \frac{ {\text{Actual Sales} - \text{Break-Even Sales}}}{\text{Actual Sales}} \) — how far sales can fall before reaching break-even. It can be stated in units, in currency, or as the percentage shown here.
- Target-profit volume
- The volume needed for a chosen profit rather than zero: \( \frac{ {\text{Fixed Costs} + \text{Target Profit}}}{\text{CM}} \). Entering fixed costs plus the target profit into the fixed-costs field of a break-even calculator produces the same answer.
- Relevant range
- The band of activity over which fixed costs stay fixed and variable cost per unit stays roughly constant. Outside it — a new lease, a second machine, a bulk-purchase discount — the cost structure changes and break-even must be recalculated.
- Operating leverage
- The degree to which a cost structure relies on fixed rather than variable costs: \( \text{Degree of Operating Leverage} = \frac{ {\text{Contribution Margin (total)}}}{\text{Operating Profit}} \). High operating leverage means a high break-even point but steep profit growth once it is passed — and steep losses if volume falls short.
- Sales mix
- The proportion in which a multi-product business sells its items. Break-even is then computed with the weighted-average contribution margin: \( \text{Weighted-Average CM} = \sum (\text{CM}_i \times \text{Sales Mix Share}_i) \), and \( \text{BE units (total)} = \frac{ {\text{Fixed Costs}}}{\text{Weighted-Average CM}} \), split back across products in the same proportions. A shift in mix toward lower-margin products raises the break-even point even if total unit volume is unchanged.
Definitions here follow standard managerial-accounting usage; terminology and cost classifications can differ between financial reporting frameworks and tax rules in your country. This is general information, not accounting or financial advice.