
What is First Pass Yield (FPY)?
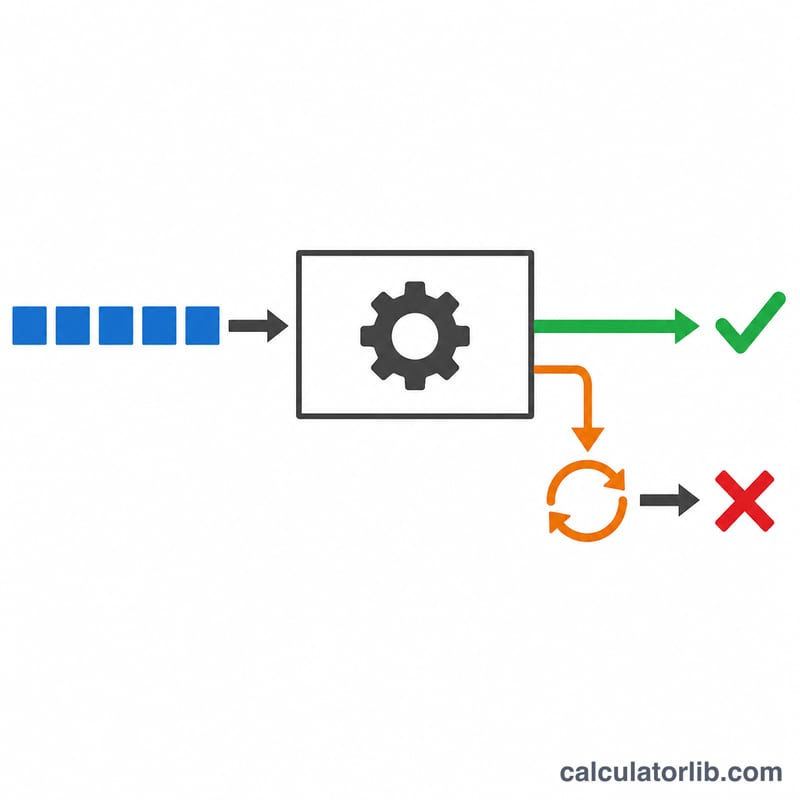
First Pass Yield (FPY), also called first time yield, is a quality metric that tells you what fraction of units pass through a process correctly on the first attempt — without any rework, repair, or scrap. It is a more honest measure of process health than final yield, because final yield can hide hidden factory costs created by rework loops. A process can ship 100% of units while quietly reworking half of them; FPY exposes that waste.
How to use this calculator
Enter the number of units that entered the process step and the number of units that passed the first time (good units that needed no rework). The calculator returns your FPY as a percentage and ratio, the number of defective or reworked units, and the defect rate. Count a unit as "passed first time" only if it required no rework whatsoever.
The formula explained
FPY = Units passed first time ÷ Units entering. Multiply by 100 for a percentage.
$$\text{FPY} = \frac{\text{Units Passed}}{\text{Units Entered}} \times 100\%$$For a multi-step process, the Rolled Throughput Yield (RTY) is the product of each step's FPY: \(\text{RTY} = \text{FPY}_1 \times \text{FPY}_2 \times \ldots \times \text{FPY}_n\). Because yields multiply, even high individual yields can compound into a low overall RTY across many steps.

Worked example
A line starts with 1,000 units. 920 pass the first time; 80 needed rework or were scrapped.
$$\text{FPY} = \frac{920}{1{,}000} = 0.92 = 92\%$$with an 8% defect rate. If a later step has FPY of 95%, the RTY for both steps is \(0.92 \times 0.95 = 0.874 = 87.4\%\).
Interpreting Your FPY Result
First Pass Yield (FPY) is the share of units that pass a process step, or the whole process, the first time with no rework, repair or retest. The complement, \(100\% - \text{FPY}\), is the first-pass defect rate. For example, 933 good units out of 1,000 entered gives \(\text{FPY} = \frac{933}{1000} \times 100\% = \)93.3%, which means 67 units (6.7%) needed rework or were scrapped.
Typical bands
| FPY | What it usually implies |
|---|---|
| Below 80% | A significant "hidden factory": a large share of capacity goes to rework, retesting and scrap. Costs, lead times and variability are high, and root-cause work is usually the top priority. |
| 80–90% | Rework is still a major burden. Expect regular rework loops, buffer stock and extra inspection. Pareto analysis of defect causes usually pays off quickly. |
| 90–95% | Moderate performance. Rework is visible but manageable. Gains now come from targeting the few dominant defect types. |
| 95–99% | Good control. Rework and scrap are small but can still be costly on high-volume or high-value products. Improvement needs tighter process capability and mistake-proofing. |
| 99%+ | Excellent. Rework is rare, and each remaining defect is often tied to specific, investigable causes. Check that inspection is effective, because a very high FPY can also come from weak testing. |
These bands are rules of thumb, not universal standards. What counts as good depends on product complexity, the cost of failure and the industry.
Link to defect rate and sigma level
If each unit is treated as one opportunity for a defect, FPY converts to an approximate process sigma level using the conventional 1.5σ long-term shift used in Six Sigma practice:
- About 69.1% ≈ 2σ
- About 93.3% ≈ 3σ (about 66,807 defects per million)
- About 99.38% ≈ 4σ (about 6,210 defects per million)
- About 99.977% ≈ 5σ (about 233 defects per million)
- About 99.99966% ≈ 6σ (3.4 defects per million)
This is only an approximation. Sigma levels are properly defined per opportunity, so units with many opportunities for a defect will look different.
Caveats
- Definition matters: FPY depends on what "passed first time" means. Counting a unit that was adjusted, reworked or retested as a pass overstates FPY. Use one consistent definition when comparing lines, shifts or periods.
- FPY is step-specific: a single-step FPY says nothing about losses elsewhere. To judge a multi-step process, combine the step yields into Rolled Throughput Yield (RTY).
- Sample size: small batches give noisy FPY values, so track results over time.
FPY and RTY Across Multi-Step Scenarios
Rolled Throughput Yield is the product of each step's FPY: \(\text{RTY} = \text{FPY}_1 \times \text{FPY}_2 \times \dots \times \text{FPY}_n\). Small losses at each step compound, so a process made of individually "good" steps can still have a poor overall yield. The table shows how many good units you would expect from 1,000 started, assuming each step's FPY is independent and rounded to the nearest whole unit.
| Scenario | Number of steps | Per-step FPY | Resulting RTY | Good units out of 1,000 started |
|---|---|---|---|---|
| A | 5 | 99% each | \(0.99^5 \approx 95.1\%\) | ≈ 951 |
| B | 5 | 95% each | \(0.95^5 \approx 77.4\%\) | ≈ 774 |
| C | 10 | 99% each | \(0.99^{10} \approx 90.4\%\) | ≈ 904 |
| D | 10 | 95% each | \(0.95^{10} \approx 59.9\%\) | ≈ 599 |
| E (mixed) | 4 | 98%, 95%, 99%, 97% | \(0.98 \times 0.95 \times 0.99 \times 0.97 \approx 89.4\%\) | ≈ 894 |
| F (mixed, one weak step) | 5 | 99%, 98%, 97%, 92%, 99% | \(0.99 \times 0.98 \times 0.97 \times 0.92 \times 0.99 \approx 85.7\%\) | ≈ 857 |
What the comparison shows
- Step count matters: going from 5 to 10 steps at 95% drops RTY from about 77% to about 60%.
- Each point counts: raising every step from 95% to 99% in a 10-step process lifts RTY from about 59.9% to about 90.4%.
- Weak steps dominate: in scenario F, the single 92% step costs more yield than the other four steps combined. Improving the lowest-FPY step usually gives the biggest return.
These figures assume steps fail independently and that failed units are not reworked back into the count. If you rework units and count them as passed, the real throughput will be higher, but the FPY and RTY of the process as designed stay the same.
FAQ
How is FPY different from final yield? Final yield counts units shipped after rework; FPY counts only units right the first time, so \(\text{FPY} \le \text{final yield}\).
What is a good FPY? It varies by industry, but higher is better. Many manufacturers target 95%+; world-class processes approach Six Sigma levels.
Can FPY exceed 100%? No. Passed units can never exceed entered units, so FPY is always between 0% and 100%.