What Is the GDP Gap?
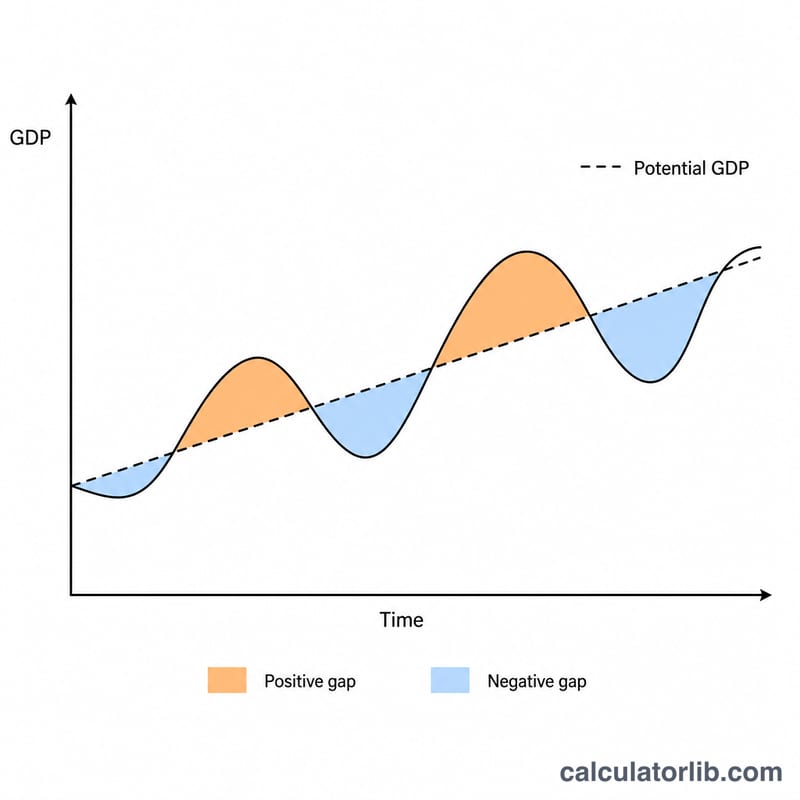
The GDP gap, also called the output gap, measures the difference between an economy's actual gross domestic product and its potential GDP — the level of output the economy could sustain at full employment without accelerating inflation. It is expressed as a percentage of potential GDP. A negative gap signals a recessionary economy operating below capacity, while a positive gap indicates an inflationary economy running above its sustainable level.
How to Use This Calculator
Enter your Actual GDP (the real, observed output) and your Potential GDP (the estimated full-employment output). The calculator returns the gap as a percentage of potential GDP along with the raw gap amount. Use consistent units and currency for both inputs — billions, trillions, or index points all work as long as both fields match.
The Formula Explained
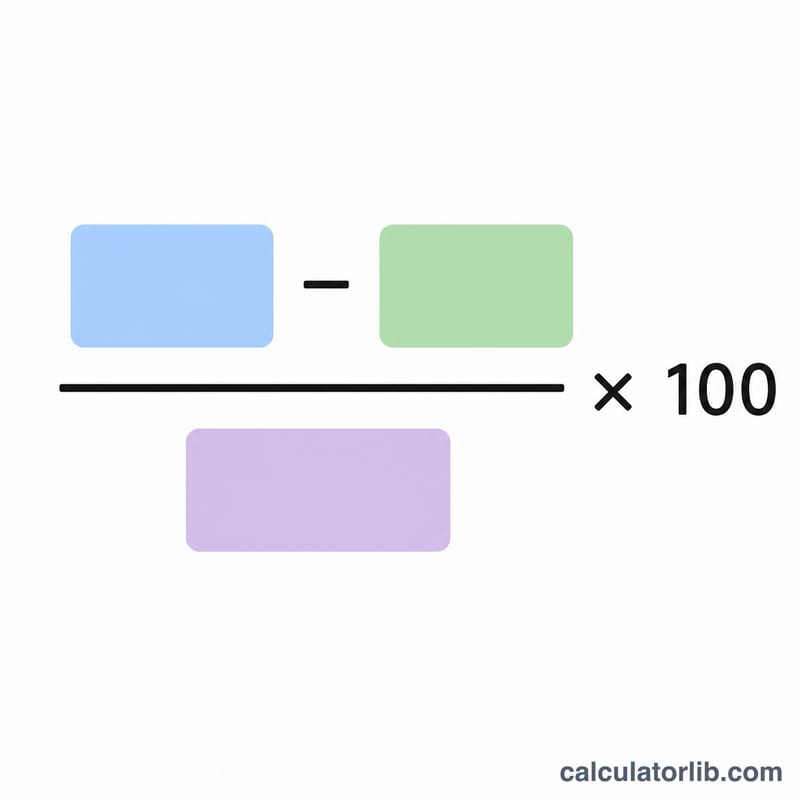
The GDP gap is calculated as $$\text{GDP Gap} = \frac{\text{Actual GDP} - \text{Potential GDP}}{\text{Potential GDP}} \times 100\%$$ Subtracting potential from actual GDP gives the absolute shortfall or excess; dividing by potential GDP scales it relative to the economy's size, and multiplying by 100 converts it to a percentage. A result of \(-2.5\%\) means actual output is 2.5% below potential.
Worked Example
Suppose actual GDP is 19,500 and potential GDP is 20,000. The gap amount is \(19{,}500 - 20{,}000 = -500\). Dividing by 20,000 gives \(-0.025\), and multiplying by 100 yields a GDP gap of −2.5%. $$\text{GDP Gap} = \frac{19{,}500 - 20{,}000}{20{,}000} \times 100\% = -2.5\%$$ The economy is operating 2.5% below its potential, suggesting underused resources and room for expansionary policy.
Interpreting the GDP Gap Result
The GDP gap (output gap) compares what an economy is actually producing with what it could produce at a sustainable, normal level of resource use:
$$\text{GDP Gap} = \frac{ \text{Actual GDP} - \text{Potential GDP} }{ \text{Potential GDP} } \times 100\%$$
- Negative gap (recessionary gap): Actual GDP is below potential. Labor and capital are underused, so unemployment tends to be above its normal level and inflation pressure tends to be weak or falling.
- Positive gap (inflationary gap): Actual GDP is above potential. The economy is running "hot": firms and workers are stretched beyond normal capacity, unemployment tends to be below its sustainable level, and wage and price pressures tend to build.
- Gap near zero: Output is close to potential. The economy is using its resources at a sustainable pace, consistent with full employment and stable inflation.
Why magnitude matters
Small gaps of about ±1–2% are usually seen as normal business-cycle fluctuations. Larger negative gaps (for example -5% or worse) point to deep slack and prolonged economic weakness. Larger positive gaps point to significant overheating that is hard to sustain.
Links to unemployment and inflation
Okun's law is an empirical rule of thumb linking the output gap to unemployment. In its classic US formulation, a gap of roughly 2 percentage points of GDP corresponds to about a 1 percentage point difference between actual and natural unemployment. The exact coefficient varies by country and time period. Inflation usually responds more slowly and less predictably: persistent positive gaps tend to add upward pressure on prices, while persistent negative gaps tend to restrain it.
Policy discussion
In standard macroeconomic analysis, a negative gap is associated with stabilization options such as lower interest rates (monetary policy) or higher government spending or lower taxes (fiscal policy). A positive gap is associated with the opposite: tighter monetary policy or fiscal restraint. How far to act is debated, and policy works with lags.
Uncertainty
Potential GDP cannot be observed directly. It is estimated using models of productivity, labor force and capital, and agencies such as national statistical offices, central banks, the IMF and the OECD often revise their estimates, sometimes substantially. The calculated gap is therefore an approximation and may change as data and methods are updated. This is general educational information, not advice.
GDP Gap Scenarios Compared
The figures below are illustrative only, not real country data. Actual and potential GDP use the same units (for example, billions of a currency, in real terms).
| Actual GDP | Potential GDP | Gap amount | Gap % | Economic state |
|---|---|---|---|---|
| 19,000 | 20,000 | -1,000 | -5.0% | Deep recession, large slack |
| 19,500 | 20,000 | -500 | -2.5% | Recessionary gap, weak economy |
| 20,000 | 20,000 | 0 | 0.0% | At potential (full employment) |
| 20,400 | 20,000 | +400 | +2.0% | Mild inflationary gap, running hot |
| 20,800 | 20,000 | +800 | +4.0% | Overheating, strong inflation pressure |
Example calculation for the first row: \(\frac{19{,}000 - 20{,}000}{20{,}000} \times 100\% = \frac{-1{,}000}{20{,}000} \times 100\% = -5.0\%\).
Key Terms and Definitions
- Actual GDP
- The total value of final goods and services an economy actually produces in a period. Nominal GDP is measured at current prices, so it rises with inflation even if output does not. Real GDP is adjusted for inflation (measured at constant prices). Use real values for both actual and potential GDP, so the gap reflects differences in output rather than price changes.
- Potential GDP
- The estimated level of real output an economy can sustain when labor and capital are used at normal intensity, without generating accelerating inflation. It is estimated, not directly observed, and is often revised.
- Output gap
- The difference between actual and potential GDP, usually expressed as a percentage of potential GDP.
- Recessionary gap
- A negative output gap in which actual GDP is below potential, usually accompanied by higher unemployment and weak inflation pressure.
- Inflationary gap
- A positive output gap in which actual GDP exceeds potential, usually accompanied by tight labor markets and rising inflation pressure.
- Full employment / NAIRU
- Full employment does not mean zero unemployment. It is the level at which only frictional and structural unemployment remain. NAIRU (non-accelerating inflation rate of unemployment) is the unemployment rate consistent with stable inflation. It is also an estimate and changes over time.
- Business cycle
- The recurring pattern of expansions and contractions in economic activity around its long-run trend. The output gap is one common way to describe where an economy sits in that cycle.
GDP and GDP per capita: United States
Official GDP and population figures for United States, updated automatically. They work the formula above with real numbers.
- GDP per capita 2025
- 90,027 USD
- GDP 2025
- 30,770 billion USD
- Population 2025
- 341.78 million
Latest change Up +4.5% 2025: 90,027 USD, against 86,170 USD in 2024. CalculatorLib computes this change from the two published figures.
In 2025, the GDP of United States was 30,770 billion USD and its population 341.78 million: 30,770 billion ÷ 341.78 million = 90,027 USD per person.
GDP deflator 2025: nominal GDP 30,770 billion USD ÷ real GDP 25,147 billion USD × 100 = 122.36.
| Year | GDP (billion USD) | Population (million) | GDP per capita (USD) | GDP deflator |
|---|---|---|---|---|
| 2025 | 30,770 | 341.78 | 90,027 | 122.4 |
| 2024 | 29,298 | 340.00 | 86,170 | 119.0 |
| 2023 | 27,812 | 336.76 | 82,587 | 116.1 |
| 2022 | 26,055 | 334.00 | 78,009 | 112.0 |
| 2021 | 23,726 | 332.10 | 71,441 | 104.6 |
| 2020 | 21,375 | 331.58 | 64,465 | 100.0 |
| 2019 | 21,540 | 330.23 | 65,228 | 98.7 |
| 2018 | 20,657 | 328.53 | 62,876 | 97.1 |
| 2017 | 19,612 | 326.61 | 60,048 | 94.9 |
| 2016 | 18,805 | 324.35 | 57,977 | 93.2 |
United States and other countries
GDP per capita in current US dollars — each country’s latest published year.
- United States 90,027 USD (2025)
- France 48,986 USD (2025)
- South Korea 36,227 USD (2025)
- Japan 35,951 USD (2025)
- Saudi Arabia 34,537 USD (2025)
- Türkiye 18,599 USD (2025)
- Russia 17,547 USD (2025)
- World 14,406 USD (2025)
- Mexico 13,889 USD (2025)
- China 13,862 USD (2025)
- Vietnam 5,066 USD (2025)
- India 2,702 USD (2025)
No published figure yet for Taiwan.
Years can differ between rows: each figure is shown with its own year. The same World Bank indicator for every country.
Latest figure: 2025 Data last updated 2026-10-17 · current
Source: The World Bank Group CC BY 4.0; World Bank, World Development Indicators CC BY 4.0
The GDP ÷ population example and the GDP deflator worked from nominal and real GDP are computed by CalculatorLib from these data.
Source details and methodology
- The World Bank Group — World Development Indicators (NY.GDP.PCAP.CD, NY.GDP.MKTP.CD, NY.GDP.DEFL.ZS, NY.GDP.MKTP.CN, NY.GDP.MKTP.KN)
- World Bank, World Development Indicators — World Development Indicators (SP.POP.TOTL)
FAQ
What does a negative GDP gap mean? It means actual output is below potential — a recessionary gap with idle capacity and likely higher unemployment.
What does a positive GDP gap mean? Actual output exceeds potential — an inflationary gap where the economy may overheat.
Where do I get potential GDP? Agencies like the Congressional Budget Office or central banks publish estimates; it is modeled, not directly observed.