
What is the Line of Best Fit?
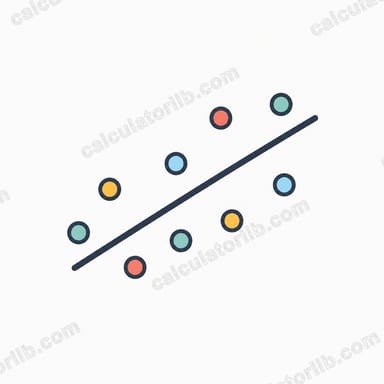
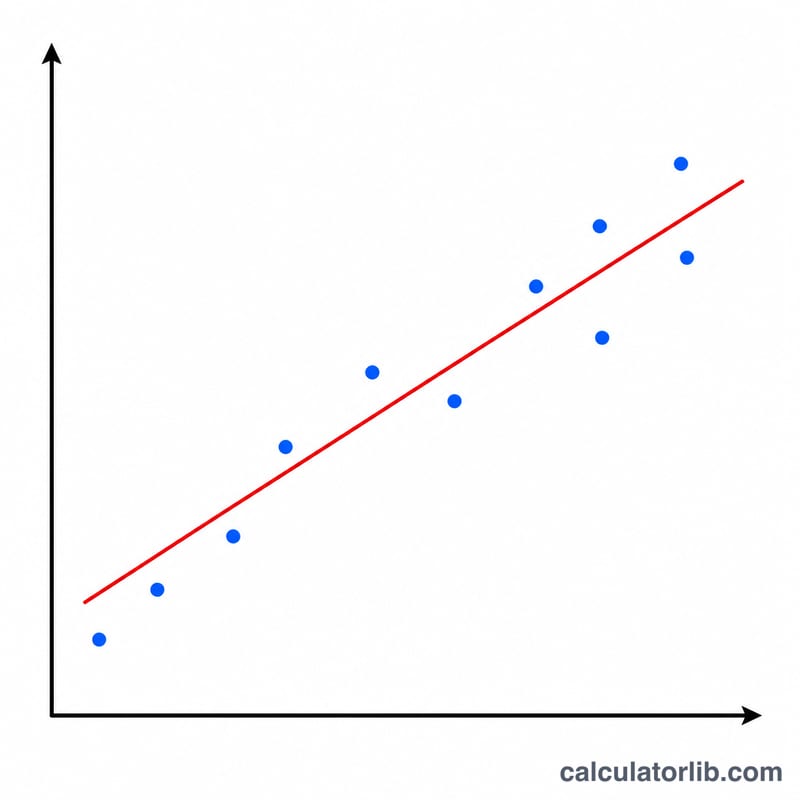
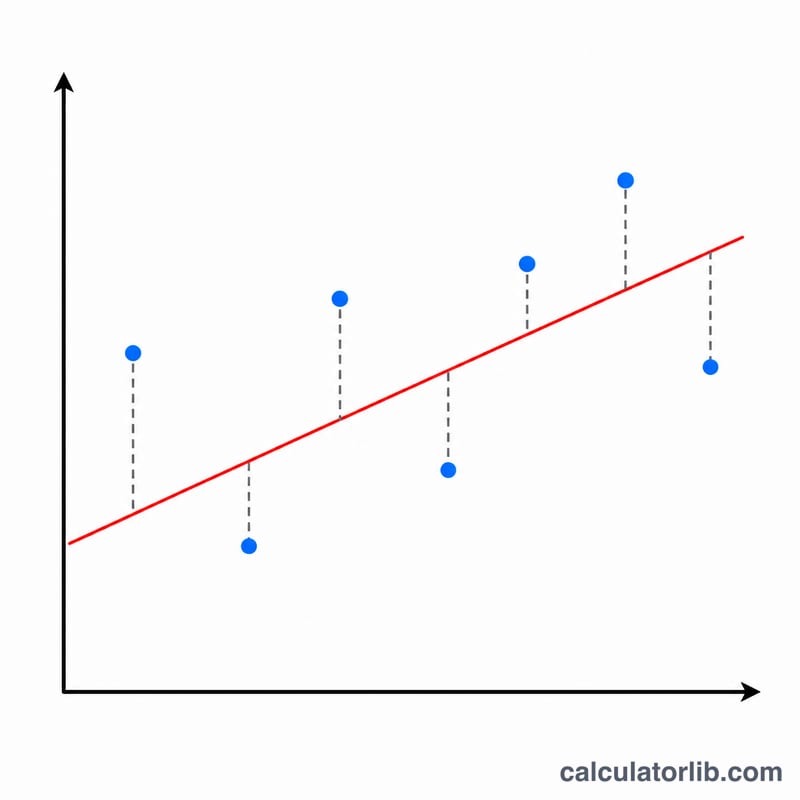
The line of best fit, also called the linear regression line, is the straight line \(y = mx + b\) that minimizes the total squared vertical distance between itself and a set of data points. It summarizes the relationship between an independent variable (x) and a dependent variable (y), letting you describe trends and make predictions. This calculator uses the ordinary least-squares method, the standard approach taught in statistics and used across science, finance, and engineering.
How to Use This Calculator
Enter your X values and Y values as comma- or space-separated lists. Make sure each X has a matching Y in the same position — the calculator pairs them by order. Click calculate to get the slope (m), the y-intercept (b), the full equation, the correlation coefficient (r), and R² (the coefficient of determination, which tells you what fraction of the variation in y is explained by x).
The Formula Explained
With n data points, the slope is $$m = \frac{n\sum xy - \left(\sum x\right)\left(\sum y\right)}{n\sum x^{2} - \left(\sum x\right)^{2}},$$ and the intercept is $$b = \frac{\sum y - m\sum x}{n}.$$ Here \(\sum xy\) is the sum of each x times its paired y, \(\sum x^{2}\) is the sum of squared x values, and \(\sum x\) and \(\sum y\) are the simple sums. These come from setting the derivatives of the squared-error function to zero.
Worked Example
For X = 1, 2, 3, 4, 5 and Y = 2, 4, 5, 4, 5: \(n = 5\), \(\sum x = 15\), \(\sum y = 20\), \(\sum xy = 66\), \(\sum x^{2} = 55\). Slope $$m = \frac{5\cdot 66 - 15\cdot 20}{5\cdot 55 - 15^{2}} = \frac{330 - 300}{275 - 225} = \frac{30}{50} = 0.6.$$ Intercept $$b = \frac{20 - 0.6\cdot 15}{5} = \frac{20 - 9}{5} = 2.2.$$ So the best-fit line is \(y = 0.6x + 2.2\).
FAQ
What does R² mean? R² ranges from 0 to 1 and gives the proportion of the variance in y explained by the linear relationship. An R² of 0.9 means 90% of the variation is captured by the line.
What if my points are vertical? If all x values are identical, the slope is undefined (division by zero); the calculator returns zero in that case since no single non-vertical line fits.
Do X and Y need the same count? Yes — pairs are matched by position. Extra unpaired values at the end are ignored.