What Is Machine Utilization Rate?
Machine utilization rate measures how much of a machine's available time is actually spent producing output. It is a core metric in manufacturing, equipment management, and capacity planning, helping you spot underused assets, justify new investment, and identify excessive downtime. A higher utilization rate generally means you are getting more value from your capital equipment.
How to Use This Calculator
Enter two numbers: the actual run time (hours the machine was genuinely operating) and the available time (the total scheduled hours the machine could have run). The calculator divides run time by available time and multiplies by 100 to give the utilization percentage, along with the remaining idle or down time.
The Formula Explained
The calculation is simple: $$\text{Utilization (\%)} = \frac{\text{Actual Run Time (hours)}}{\text{Available Time (hours)}} \times 100$$. "Available time" is the denominator and should reflect the scheduling basis you care about — a single 8-hour shift, a 24-hour day, or a full work week. Keep both numbers in the same unit (usually hours).
Worked Example
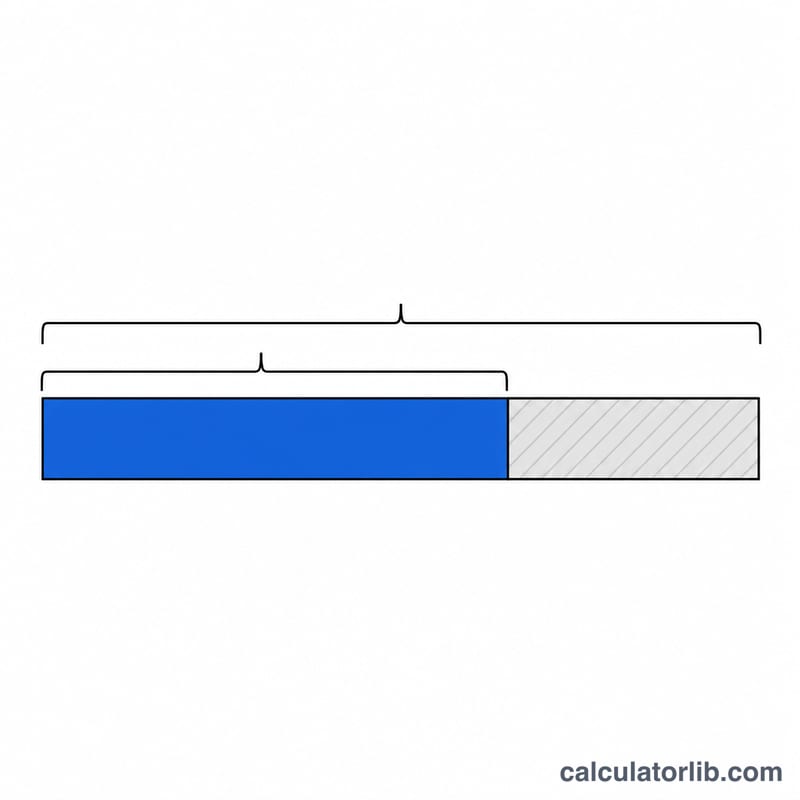
Suppose a CNC machine was scheduled to be available for 24 hours in a day but only ran for 18 hours. Utilization $$= \frac{18}{24} \times 100 = \textbf{75\%}$$, leaving 6 hours of idle or downtime. This tells managers that a quarter of the machine's potential capacity went unused.
Interpreting Your Utilization Result
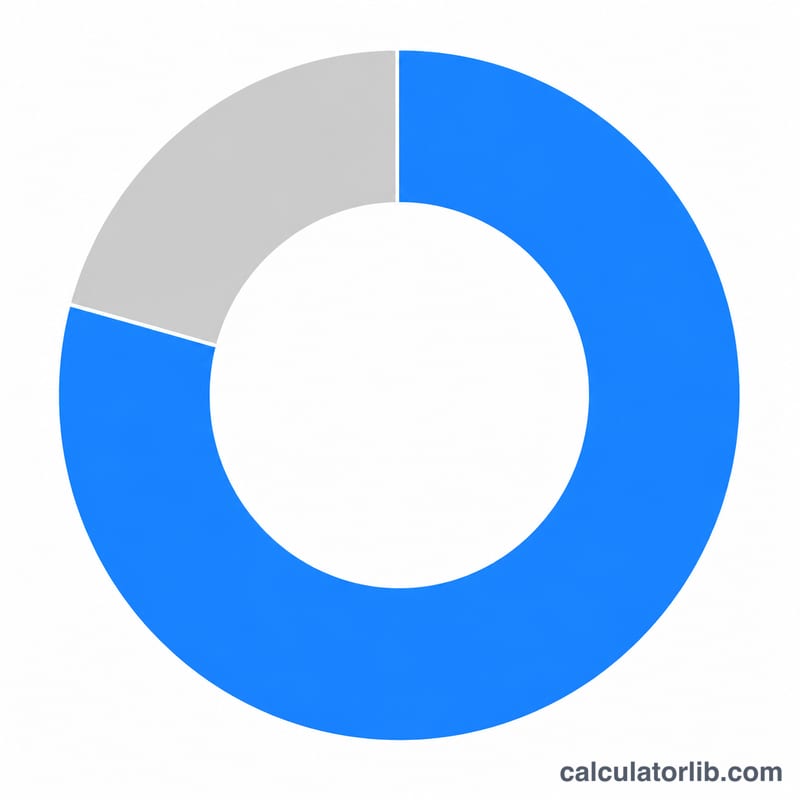
Machine utilization is the share of available time that a machine actually spends running: \(\text{Utilization} = \frac{ \text{Run Time} }{ \text{Available Time} } \times 100\). For example, 140 hours of run time out of 200 available hours gives \(\frac{140}{200} \times 100 = \) 70%, leaving 60 idle hours.
The bands below are general industry rules of thumb. They are not a formal standard and vary widely by process type, industry and business model.
| Utilization band | What it typically suggests |
|---|---|
| Under ~60% | Significant idle capacity. Possible causes include scheduling gaps, low demand, long waits for material or operators, frequent breakdowns, or excess equipment. |
| ~60–70% | Moderate utilization. There is room to improve, but some idle time may be unavoidable in high-mix or make-to-order work. |
| ~70–85% | Often considered healthy for general manufacturing. It balances output with room for maintenance, changeovers and variation in demand. |
| Above ~90% | Little slack. This may leave no time for maintenance, changeovers or demand spikes. It can indicate a bottleneck and raise the risk of breakdowns and late orders. |
Check the time basis. The result depends on what you enter as available time:
- Calendar time (e.g. 24 h × 7 days) gives the lowest percentage, because it includes nights, weekends and holidays when the machine was not planned to run.
- Scheduled time (shifts the plant is staffed and operating) is the most common basis for shop-floor comparison.
- Planned operating time (scheduled time minus planned stops such as breaks and planned maintenance) gives the highest percentage.
Always compare results using the same basis, and use the same period (shift, week or month) when tracking trends. Continuous-process equipment often targets much higher utilization than job-shop machines, so benchmark against similar equipment.
Key Terms and Definitions
- Actual run time
- The hours the machine was actually powered and producing (or cutting) during the measured period. It excludes stops, waiting and setup.
- Available time
- The total hours against which utilization is measured. It may be calendar time, scheduled time or planned operating time, depending on the company's policy. State which one you use.
- Scheduled time
- The hours the machine is planned to be in operation according to the shift pattern or production schedule.
- Planned downtime
- Stops that are scheduled in advance, such as preventive maintenance, breaks, changeovers, training or calibration.
- Unplanned downtime
- Unexpected stops such as breakdowns, material shortages, tool failures, power loss or absent operators.
- Idle time
- Available time during which the machine is not running. In this calculator it equals available time minus actual run time, so it includes both planned and unplanned stops, as well as time with no work to do.
- Capacity utilization
- The share of potential capacity that is used. Machine utilization is a time-based measure of this. Broader capacity utilization can also be measured in output units against maximum possible output.
- Utilization vs. availability
- Availability (an OEE component) is the share of planned production time during which the machine was able to run, so it accounts for downtime only. Utilization compares run time with the chosen available time, and it also reflects idle time caused by lack of orders or staffing.
- Utilization vs. OEE
- Overall Equipment Effectiveness multiplies availability, performance (speed) and quality (good parts). Utilization looks only at time. A machine can show 90% utilization and still have poor OEE if it runs slowly or produces scrap.
FAQ
Is utilization the same as OEE? No. Utilization only looks at run time versus available time. Overall Equipment Effectiveness (OEE) also factors in performance speed and quality yield.
What counts as "available time"? That depends on your standard. You might use calendar time, scheduled production time, or planned operating time minus planned maintenance — be consistent.
Can utilization exceed 100%? Not normally. If run time exceeds available time, your available-time figure is likely understated.