What Is the Range in Statistics?
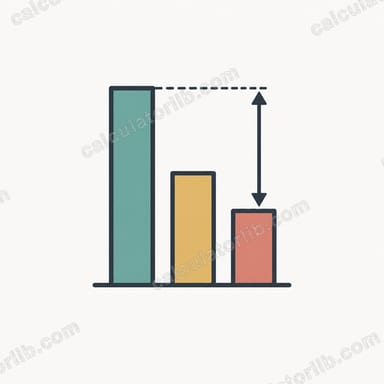
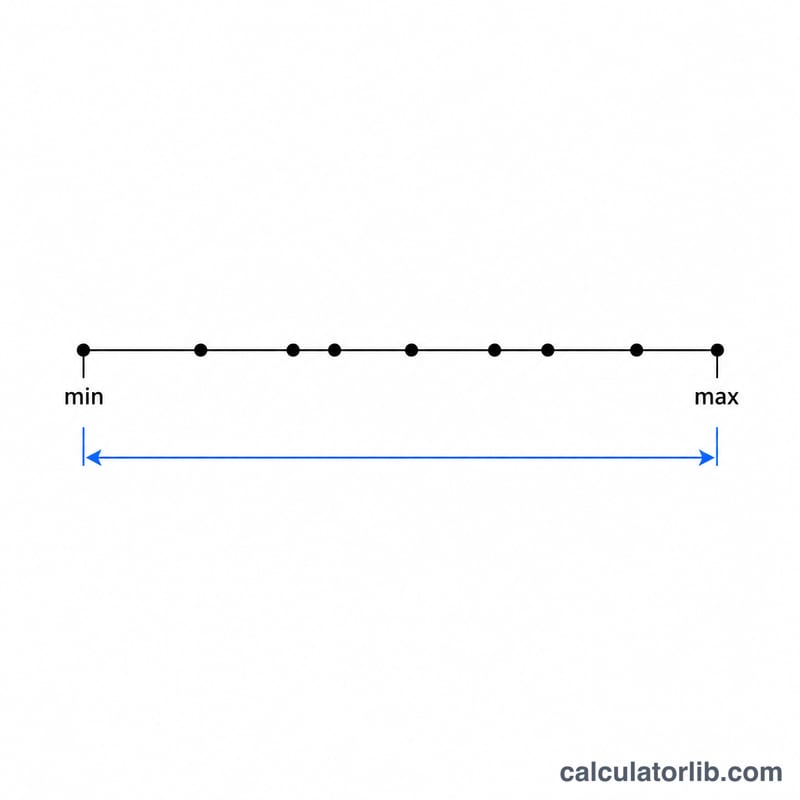
The range is the simplest measure of dispersion in a data set. It tells you how far apart the largest and smallest values are by subtracting the minimum from the maximum. A larger range means the values are more spread out; a smaller range means they cluster closely together.
How to Use This Calculator
Type your numbers into the box, separated by commas or spaces (for example, 4, 8, 15, 16, 23, 42). The calculator scans the list, finds the maximum and minimum values, subtracts them, and shows the range along with the count of values you entered. Both whole numbers and decimals are supported, including negatives.
The Formula Explained
The range is defined as:
$$\text{Range} = \max\!\left(\text{Numbers}\right) - \min\!\left(\text{Numbers}\right)$$
Because it depends only on the two extreme values, the range is quick to compute but sensitive to outliers. A single unusually high or low number can dramatically inflate it, which is why it is often reported alongside measures like the standard deviation or interquartile range.
Worked Example
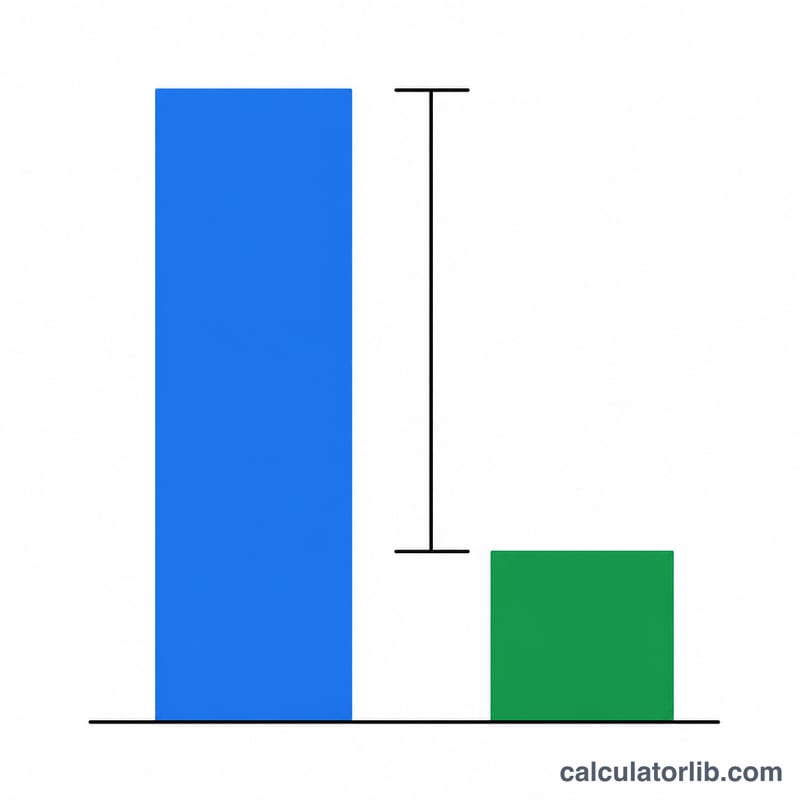
Suppose your data set is 4, 8, 15, 16, 23, 42. The maximum is 42 and the minimum is 4. The range is therefore $$42 - 4 = 38$$ 38. Even though most values fall between 4 and 23, the value 42 pushes the range up to 38, illustrating the range's sensitivity to extremes.
How Outliers and Data Shape Change the Range
The range depends only on the two extreme values, so the shape of the data between them does not matter. The table compares five small data sets using \(\text{Range} = \max - \min\).
| Data set | Max | Min | Range | Note |
|---|---|---|---|---|
| 5, 5, 5, 5 | 5 | 5 | 0 | Identical values: no spread at all. |
| 10, 11, 12, 13 | 13 | 10 | 3 | Tight cluster: small range. |
| 10, 11, 12, 13, 50 | 50 | 10 | 40 | The same cluster plus one outlier (50): the range jumps from 3 to 40 even though four of the five values are unchanged. |
| -8, -2, 0, 5 | 5 | -8 | 13 | Negatives: \(5 - (-8) = 13\). |
| 1.5, 2.25, 3.75 | 3.75 | 1.5 | 2.25 | Decimals: \(3.75 - 1.5 = 2.25\). |
The third row shows the main weakness of the range: a single extreme value can change it dramatically, while the order of the values never affects it.
Interpreting the Range
A range of 0 means the maximum and minimum are equal, so every value in the data set is identical. Any range above 0 means the values differ, and a larger range indicates a wider spread between the smallest and largest observations.
The range is expressed in the data's own units. A range of 40 for ages in years means a 40-year gap; a range of 40 for prices in dollars means a $40 gap. Because of this, ranges cannot be meaningfully compared across data sets measured in different units (for example kilograms and centimetres) or on very different scales (for example house prices and coffee prices). A larger number does not necessarily mean more relative variability.
Sample size also matters. When more observations are added to a data set, the range can stay the same or grow, but it can never shrink, because the existing maximum and minimum remain in the data. Larger samples therefore tend to show larger ranges, since they have more chances to include extreme values. This makes the range a poor basis for comparing data sets of very different sizes.
Because it uses only two values, the range is highly sensitive to outliers and says nothing about how the remaining values are distributed. Two measures are commonly used instead:
- Interquartile range (IQR): \(\text{IQR} = Q_3 - Q_1\) describes the spread of the middle 50% of the data. It ignores the lowest and highest quarters, so outliers do not affect it.
- Standard deviation: uses every value and measures the typical distance from the mean, which makes it a fuller summary of spread, though it is also influenced by outliers.
Key Terms
- Range
- The difference between the largest and smallest values in a data set: \(\max - \min\). It is never negative.
- Maximum
- The largest value in the data set.
- Minimum
- The smallest value in the data set. With negative numbers, the minimum is the most negative value.
- Outlier
- A value that lies unusually far from the bulk of the data. Outliers can strongly affect the range.
- Dispersion (spread)
- How widely the values in a data set are scattered. Range, IQR, variance and standard deviation are all measures of dispersion.
- Interquartile range (IQR)
- The difference between the third quartile (Q3) and the first quartile (Q1): \(Q_3 - Q_1\). It covers the middle 50% of the values and is not affected by outliers.
- Standard deviation
- A measure of the typical distance of values from the mean, in the same units as the data. It is the square root of the variance.
- Data set / sample size (count)
- A data set is the collection of values being analysed; the sample size, or count, is the number of values it contains, usually written \(n\).
FAQ
Can the range be negative? No. Since you always subtract the smallest value from the largest, the range is zero or positive. It equals zero only when every value is identical.
Does the range use all the data? No — only the two extreme values. That makes it easy to interpret but a poor summary of overall variability when outliers are present.
What units does the range have? The same units as your original data. If you measured in centimeters, the range is also in centimeters.