
What is Spearman's Rank Correlation?
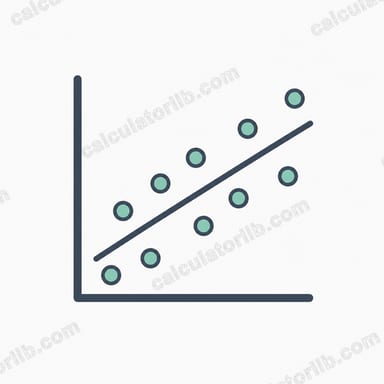
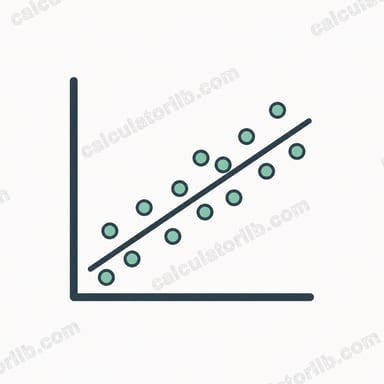
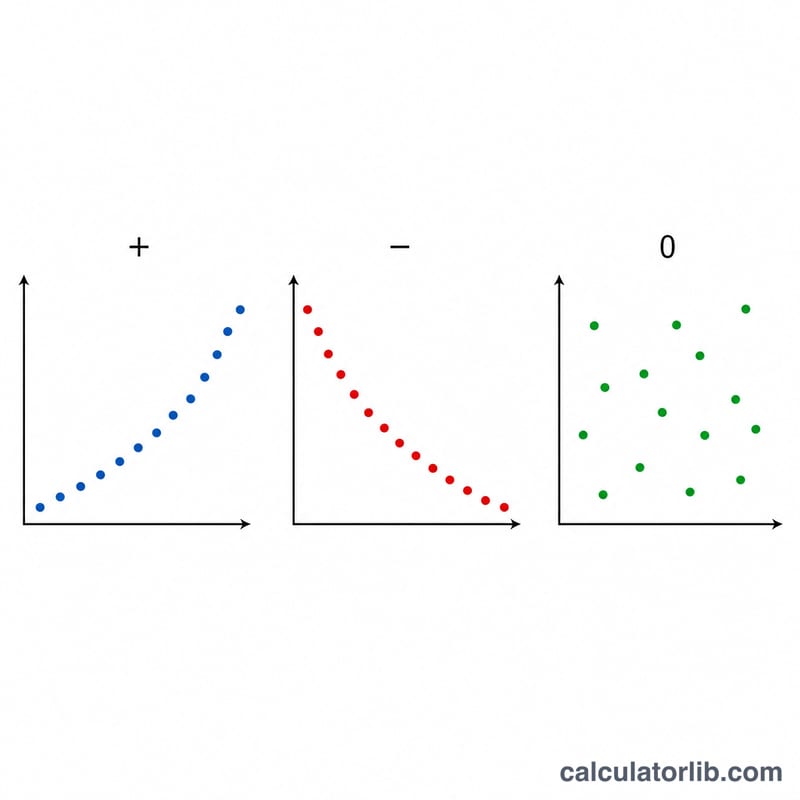
Spearman's rank correlation coefficient (\(\rho\), "rho") measures the strength and direction of a monotonic relationship between two variables. Unlike Pearson's correlation, it works on the ranks of the data rather than the raw values, so it does not assume the relationship is linear or that the data is normally distributed. \(\rho\) ranges from −1 (perfect inverse ordering) through 0 (no monotonic association) to +1 (perfect agreement).
How to Use This Calculator
Enter your two data series in the X and Y boxes, using commas or spaces to separate values. The two lists must have the same number of entries (extra values in the longer list are ignored). Press calculate to get \(\rho\), the number of pairs (\(n\)), and \(\sum d^{2}\) — the sum of squared rank differences.
The Formula Explained
For data without tied ranks, \(\rho\) is computed as:
$$\rho = 1 - \frac{6 \sum d_i^{2}}{n\,(n^{2}-1)}$$
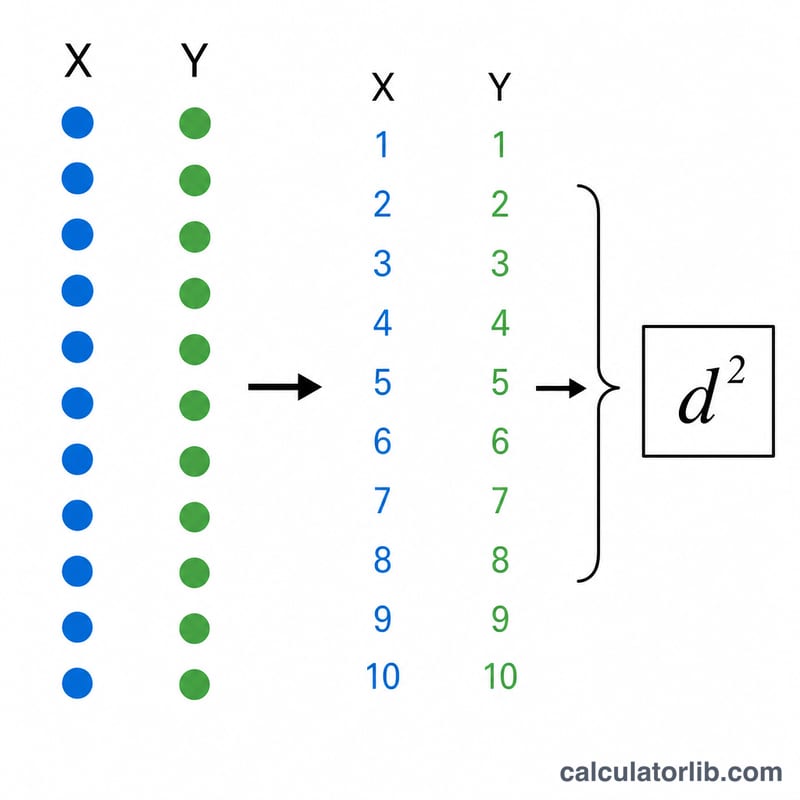
First each variable is ranked separately (smallest = rank 1). For each pair, \(d\) is the difference between its X-rank and Y-rank. Square each \(d\), sum them, and plug into the formula. When ties exist, this shortcut is biased, so the calculator automatically switches to the equivalent Pearson correlation of the ranks, using average ranks for tied values.
Worked Example
Take X = 10, 20, 30, 40, 50 and Y = 12, 24, 33, 44, 55. Both series increase together, so each has ranks 1,2,3,4,5. Every \(d = 0\), so \(\sum d^{2} = 0\) and $$\rho = 1 - \frac{6 \times 0}{5 \times 24} = 1$$ — a perfect positive monotonic relationship.
FAQ
What does \(\rho = 0\) mean? There is no monotonic trend; as X rises, Y shows no consistent rise or fall.
How is it different from Pearson's r? Pearson measures linear association on raw values; Spearman measures monotonic association on ranks, making it robust to outliers and non-linear (but ordered) relationships.
How many data points do I need? A minimum of 2 pairs is required to compute \(\rho\), but more pairs give a more reliable estimate of association.