What is a Critical t Value?
A critical t value (t*) is the cutoff point on a Student's t distribution that defines the rejection region of a hypothesis test. If your computed t statistic exceeds the critical value, you reject the null hypothesis. The critical value depends on two things: your chosen significance level (α) and the degrees of freedom (df), which for a one-sample test equals the sample size minus one.
How to Use the Calculator
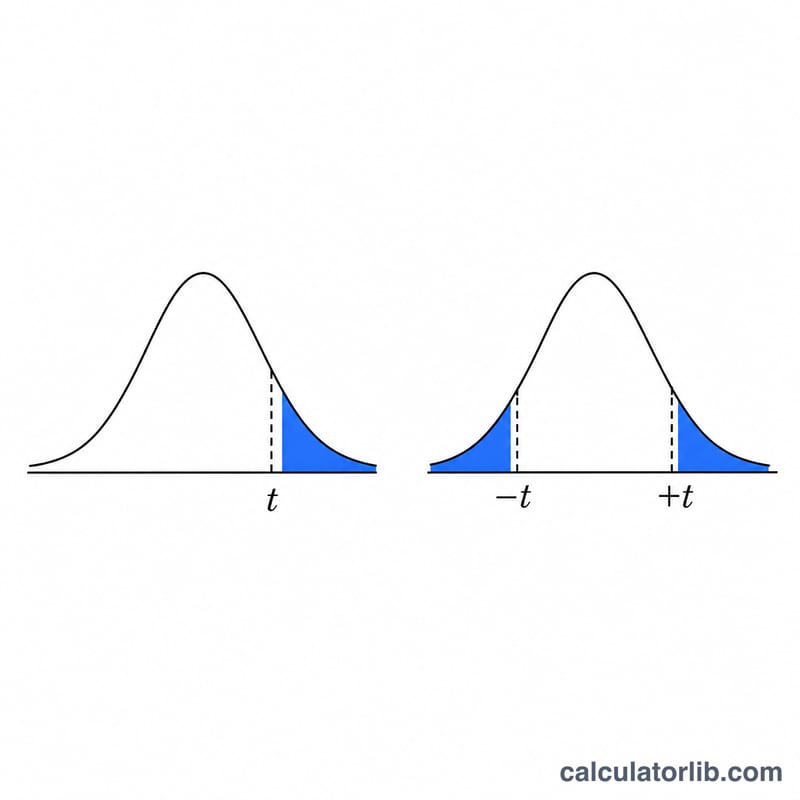
Enter your significance level — commonly 0.05, 0.01, or 0.10 — and your degrees of freedom. Choose whether your test is two-tailed (testing for a difference in either direction) or one-tailed (testing in a single direction). The calculator returns the critical t value, which you compare against your test statistic.
The Formula
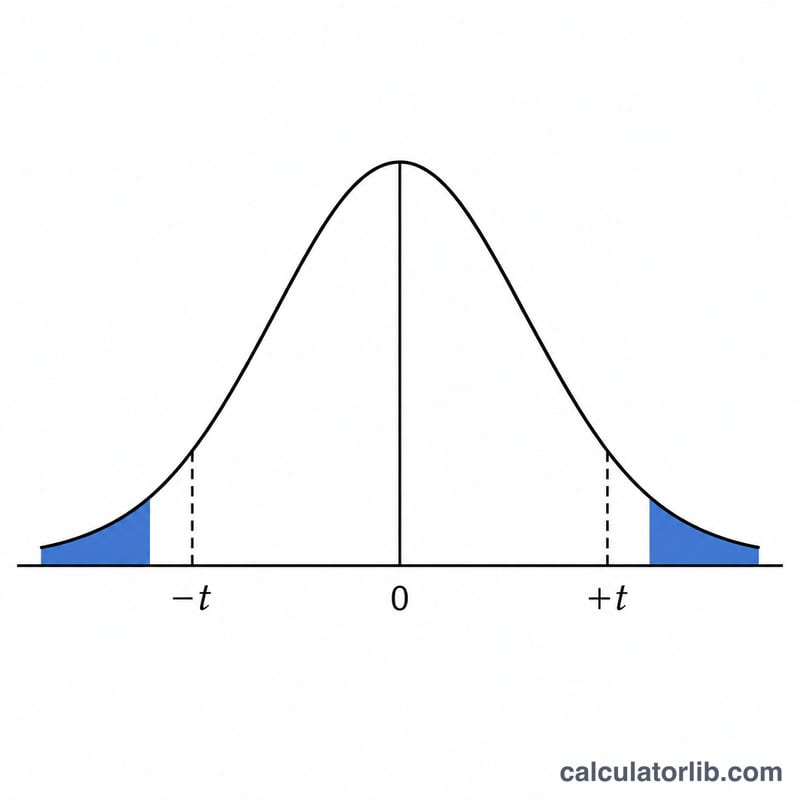
For a two-tailed test the critical value is the inverse t distribution evaluated at probability 1 − α/2: $$t^* = t^{-1}\left(1 - \frac{\alpha}{2},\ \text{df}\right)$$ For a one-tailed test it uses \(1 - \alpha\) instead. Because the t distribution is symmetric, the two-tailed value is reported as \(\pm t^*\). This tool uses Acklam's inverse-normal approximation combined with a Cornish–Fisher expansion to obtain the t quantile.
Worked Example
Suppose α = 0.05, df = 10, two-tailed. The cumulative probability is \(1 - \frac{0.05}{2} = 0.975\). Looking up the inverse t distribution gives \(t^* \approx 2.228\). So you would reject the null hypothesis if your test statistic falls below \(-2.228\) or above \(+2.228\).
FAQ
What degrees of freedom should I use? For a one-sample t-test, \(\text{df} = n - 1\). For a two-sample test it depends on the design, but a common value is \(n_1 + n_2 - 2\).
One-tailed or two-tailed? Use two-tailed unless your hypothesis specifies a direction (e.g. "greater than"). Two-tailed tests are more conservative.
Why does t* approach 1.96 for large df? As degrees of freedom increase, the t distribution converges to the standard normal distribution, so the two-tailed critical value at α = 0.05 approaches the z value of \(1.96\).


