What is a deviation score?
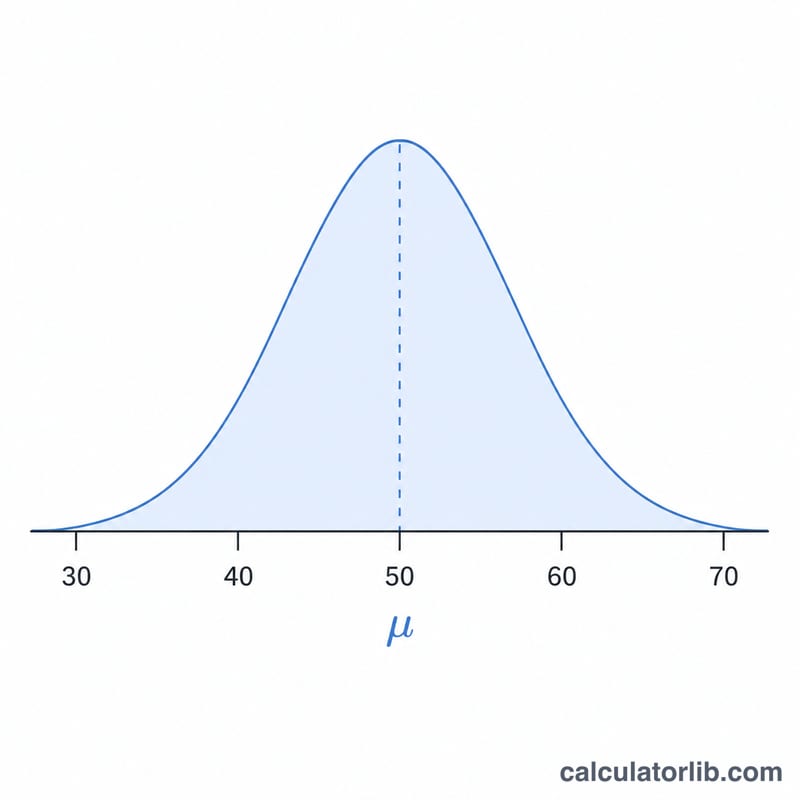
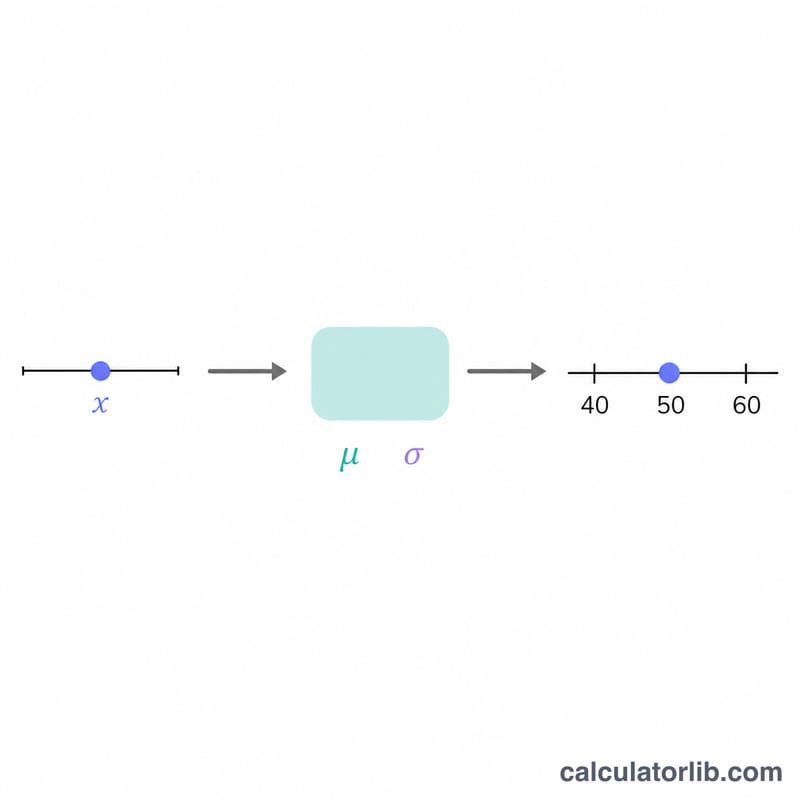
A deviation score, known in Japan as hensachi, is a T-score: a way of expressing how far a single value sits from the average of its group, measured in standard-deviation units and rescaled so the mean is exactly 50. Add 10 points for every standard deviation above the mean, subtract 10 for every standard deviation below. It is a pure statistical transform, so it works for any list of numbers, but it is most famous in the Japanese school and exam system for comparing performance across different tests.
How to use this calculator
Enter your raw scores as a grid: one row per line (each row is a person or item), with values separated by commas or spaces (each column is a subject or test). The calculator standardizes each column independently and returns a deviation score for every cell. It also adds a Total column: it sums each row, then standardizes those row totals against one another. A column mean and population standard deviation are shown for reference.
The formula
For one column of values \(x_1 .. x_m\): first the mean \(\mu = \frac{1}{m}\cdot\sum x_i\), then the population standard deviation \(\sigma = \sqrt{\frac{1}{m}\cdot\sum (x_i-\mu)^2}\). The deviation score of a value is $$T = 50 + 10\cdot\frac{x-\mu}{\sigma}$$ If a column is perfectly flat (\(\sigma = 0\)) every cell scores exactly 50 to avoid dividing by zero.
Worked example
Take column 1 of the default data: 80, 50, 70, 90, 60. The mean is \(350/5 = 70\). The squared deviations sum to 1000, so the variance is 200 and \(\sigma \approx 14.1421\). The first cell, 80, scores $$50 + 10\cdot\frac{10}{14.1421} \approx 57.07$$ The row totals are 230, 160, 220, 220, 210; their mean is 208 and \(\sigma \approx 24.8193\), giving the appended Total column.
FAQ
Why population, not sample, standard deviation? Hensachi convention divides by \(m\), not \(m-1\), so this tool uses the population formula.
What if all scores in a column are equal? The standard deviation is zero, so every cell is assigned a deviation score of 50.
Can columns have different lengths? Each row is padded to the widest row with zeros; for clean results enter a complete rectangular grid.