
What Is Earned Value Management?
Earned Value Management (EVM) is a project-management technique that integrates scope, schedule and cost to measure project performance objectively. Instead of asking "how much have we spent?", EVM asks "how much value have we earned for what we spent?" It is a universal methodology used in construction, software, defense and engineering projects worldwide.
How to Use This Calculator
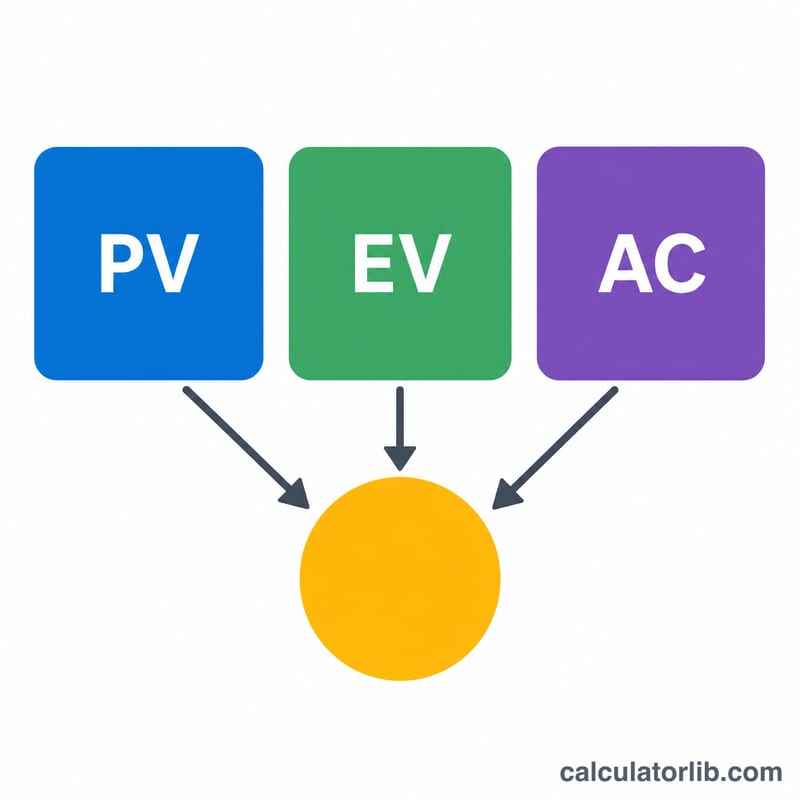
Enter three core values measured at the same point in time: Planned Value (PV) — the budgeted cost of work scheduled; Earned Value (EV) — the budgeted cost of work actually completed; and Actual Cost (AC) — what you have really spent. The calculator instantly returns Cost Variance, Schedule Variance and the CPI and SPI performance indices.
The Formulas Explained
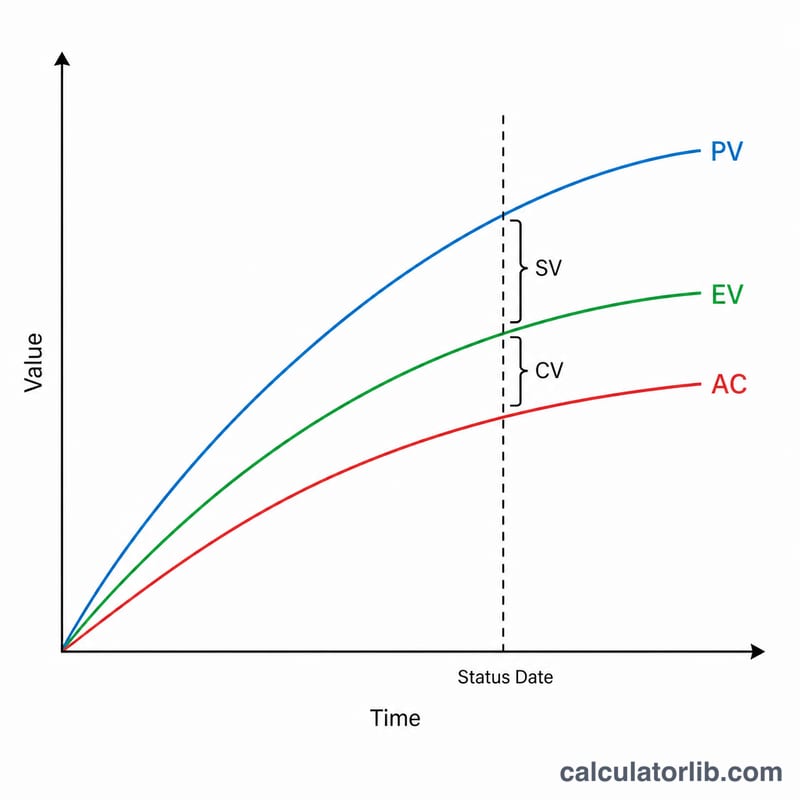
Cost Variance (\(\text{CV} = \text{EV} - \text{AC}\)) shows whether you are under or over budget; a positive number is good. Schedule Variance (\(\text{SV} = \text{EV} - \text{PV}\)) shows whether you are ahead of or behind schedule. The Cost Performance Index (\(\text{CPI} = \text{EV} \div \text{AC}\)) and Schedule Performance Index (\(\text{SPI} = \text{EV} \div \text{PV}\)) express the same ideas as efficiency ratios.
$$\begin{aligned} \text{CV} &= \text{EV} - \text{AC} \\ \text{SV} &= \text{EV} - \text{PV} \\ \text{CPI} &= \frac{\text{EV}}{\text{AC}} \\ \text{SPI} &= \frac{\text{EV}}{\text{PV}} \end{aligned}$$
An index of exactly 1.0 means on-target; above 1.0 is favorable and below 1.0 signals trouble.
Worked Example
Suppose PV = $10,000, EV = $9,000 and AC = $11,000. Then
$$\text{CV} = 9{,}000 - 11{,}000 = -\$2{,}000 \text{ (over budget)}$$ $$\text{SV} = 9{,}000 - 10{,}000 = -\$1{,}000 \text{ (behind schedule)}$$ $$\text{CPI} = \frac{9{,}000}{11{,}000} \approx 0.818$$ $$\text{SPI} = \frac{9{,}000}{10{,}000} = 0.900$$Both indices below 1.0 confirm the project is both over budget and behind schedule.
FAQ
What's the difference between EV and AC? Earned Value is the budgeted worth of completed work; Actual Cost is the money actually spent to do it.
Is a CPI above 1.0 always good? Generally yes — it means you are getting more than a dollar of value per dollar spent — but extremely high values can also signal under-reported costs or optimistic progress estimates.
What units should I use? Use the same currency for PV, EV and AC. CV and SV are returned in that currency, while CPI and SPI are unitless ratios.