
What this calculator does
This tool computes a company's growth (seichosei) financial indicators — six standard year-over-year growth ratios drawn from its income statement and balance sheet. It is modeled on Japanese financial-statement analysis (using figures from a securities report: the balance sheet and income statement), but the ratio formulas are universal and work for any GAAP. One line item, "ordinary profit" (keijo rieki), is specific to Japanese accounting and sits between operating profit and pre-tax income; non-Japanese users can leave it as a comparable figure or ignore that row.
How to use it
Enter the current-period and prior-period values for each item in the same monetary unit (the source default is thousands of yen, but the ratios are unit-independent as long as current and prior share the unit). For "Total Capital," enter total liabilities plus net assets, which equals total assets. For "Shareholders' Equity," enter the total net assets figure. The calculator returns each growth rate as a percentage.
The formula explained
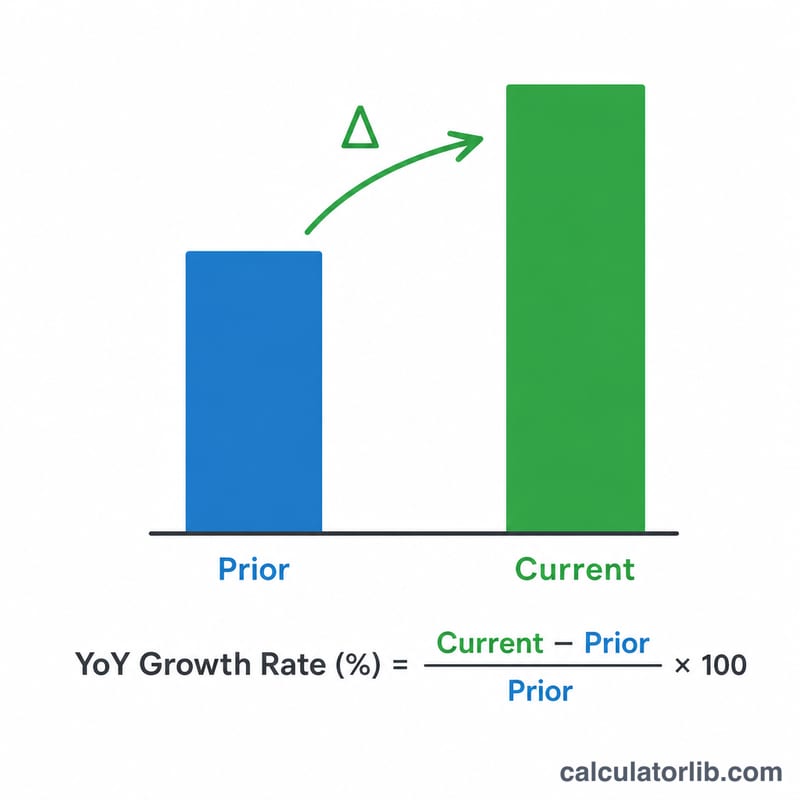
Every growth rate uses the same form:
$$\text{Sales Growth Rate} = \frac{\text{Current Sales} - \text{Prior Sales}}{\text{Prior Sales}} \times 100\%$$A positive result means the figure grew year over year; a negative result means it shrank. If a prior value is zero the rate is undefined. If a prior profit was negative (a loss) and turned positive, treat the sign with caution — the percentage can be misleading, so read it as a turnaround.
Worked example
Prior sales 100,000 and current sales 115,000 give
$$\frac{115000 - 100000}{100000} \times 100 = 15.0\%$$(excellent, since \(\geq 10\)). With operating profit 8,000 → 9,500 the rate is \(18.75\%\); ordinary profit 8,500 → 10,200 gives \(20.0\%\); net income 5,000 → 6,000 gives \(20.0\%\); total capital 120,000 → 130,000 gives \(8.33\%\); and equity 40,000 → 45,000 gives \(12.5\%\).
FAQ
What counts as a good growth rate? For sales and profit a common guide is excellent at 10% or more and a warning at \(-1\%\) or below. For total capital, even small positive growth (\(\geq 0.5\%\)) is positive; for equity, 10% or more is strong.
Does the currency unit matter? No. Because each ratio divides current by prior, the result is a pure percentage independent of the unit, as long as both figures use the same unit.
What is "ordinary profit"? It is a Japanese GAAP line (keijo rieki) equal to operating profit plus or minus non-operating income and expenses such as interest. Substitute a comparable figure if your statements do not report it.