What this calculator does
The Financial Ratios Calculator turns raw figures from a company's three core financial statements — the balance sheet, income statement, and (indirectly) cash flow statement — into the standard ratios analysts use to judge financial health. It bundles five families of ratios into one tool: Debt (leverage and solvency), Liquidity (short-term ability to pay bills), Operations (how efficiently assets and working capital are used), Profitability (how much profit is earned per unit of sales, assets, or equity), and Stock/Market ratios (per-share and valuation metrics). The definitions are jurisdiction-neutral and apply equally under GAAP or IFRS. Treat every monetary input as the same currency; ratios are dimensionless except for days-based and per-share figures.
How to use it
Enter the figures you have for each section — you do not need every field. Defaults model a small illustrative company. Each output is a single division, so a blank or zero denominator returns N/A rather than an error. Margins, yields, and returns are shown as percentages; turnover-based days metrics use the Days in Period you supply (365 or 360 are common conventions).
The formulas explained
Liquidity: Current Ratio = Current Assets / Current Liabilities; the Quick Ratio strips out inventory and prepaid expenses. Debt: Debt Ratio = Total Liabilities / Total Assets; Times Interest Earned = EBIT / Interest Expense (note it uses operating income, not net income). Operations: Inventory Turnover = COGS / Average Inventory, and DIO = Days / Inventory Turnover; the Cash Conversion Cycle = DIO + DSO − DPO. Profitability: ROE = 100 × Net Income / Equity. Stock: EPS = (Net Income − Preferred Dividends) / Shares; P/E = Price / EPS.
$$\text{Current Ratio} = \dfrac{\text{Current Assets}}{\text{Current Liabilities}}$$$$\text{Debt Ratio} = \dfrac{\text{Total Liabilities}}{\text{Total Assets}}$$$$\text{Times Interest Earned} = \dfrac{\text{EBIT}}{\text{Interest Expense}}$$$$\text{Inventory Turnover} = \dfrac{\text{COGS}}{\text{Average Inventory}}$$$$\text{DIO} = \dfrac{\text{Days}}{\text{Inventory Turnover}}$$$$\text{Cash Conversion Cycle} = \text{DIO} + \text{DSO} - \text{DPO}$$$$\text{ROE} = 100 \times \dfrac{\text{Net Income}}{\text{Equity}}$$$$\text{EPS} = \dfrac{\text{Net Income} - \text{Preferred Dividends}}{\text{Shares}}$$$$\text{P/E} = \dfrac{\text{Price}}{\text{EPS}}$$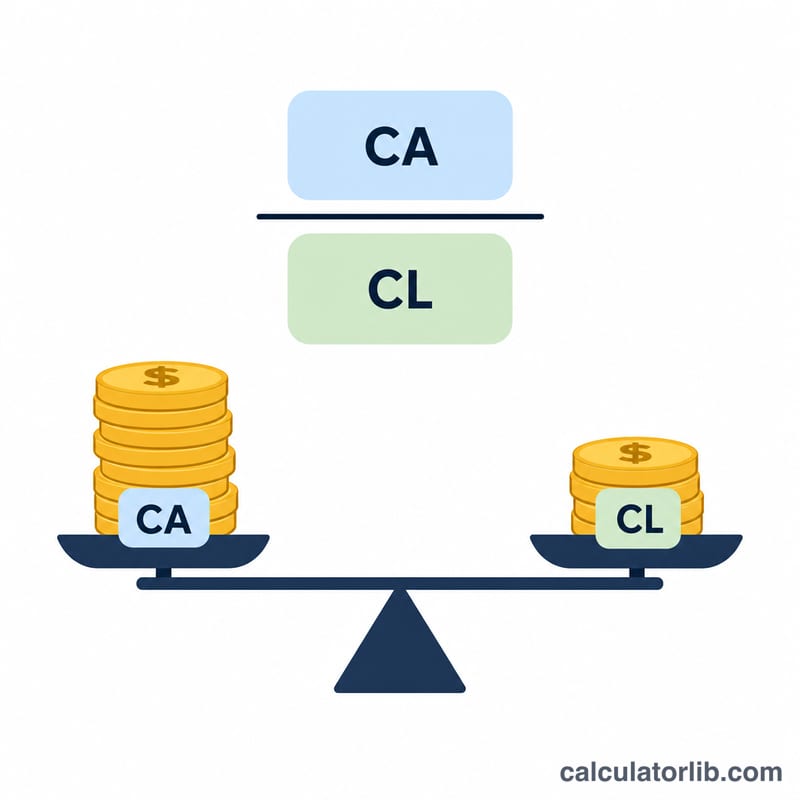
Worked example
Using the defaults: Current Assets 60,000 and Current Liabilities 30,000 give a Current Ratio of 2.0.
$$\text{Current Ratio} = \dfrac{60{,}000}{30{,}000} = 2.0$$Total Liabilities 50,000 over Total Assets 120,000 give a Debt Ratio of 0.4167.
$$\text{Debt Ratio} = \dfrac{50{,}000}{120{,}000} = 0.4167$$Net Income 20,000 over Equity 70,000 gives an ROE of 28.57%.
$$\text{ROE} = 100 \times \dfrac{20{,}000}{70{,}000} = 28.57\%$$With Net Income 20,000 and 10,000 shares, EPS = 2.0, and at a 50 price the P/E is 25.0.
$$\text{EPS} = \dfrac{20{,}000}{10{,}000} = 2.0 \qquad \text{P/E} = \dfrac{50}{2.0} = 25.0$$FAQ
Why do some results show N/A? A ratio is undefined when its denominator is zero or blank (for example P/E when EPS is zero), so the tool shows N/A instead of infinity.
Can equity or net income be negative? Yes. A loss makes margins and ROE negative, and negative equity flips D/E negative — the calculator shows these as-is so you see the real picture.
Should I use 360 or 365 days? Both are accepted conventions; 365 is the default. Use whichever matches your firm's or industry's reporting standard for consistent comparisons.