
What this calculator does
This tool computes a complete set of corporate profitability ratios from a company's income statement (P&L) and balance sheet figures, the kind of line items found in a published financial or securities report. The ratio definitions are universal accounting standards, so the math applies in any country and any currency. The original reference page uses Japanese statement structure with values in thousands of yen, but here you simply enter every monetary figure in the same unit (for example "thousands"). Because every output is a dimensionless percentage, the chosen scale cancels out.
How to use it
Enter your income statement values (revenue, cost of goods sold, gross profit, SG&A, operating income, ordinary/recurring income, and net income) and your balance sheet values (the five interest-bearing debt items, total equity, and total liabilities plus net assets). Keep all monetary inputs in the same unit. The calculator uses the profit figures you enter directly rather than recomputing them, so you can match a published statement exactly.
The formulas explained
Each profitability ratio is numerator over denominator times 100. Margins use revenue as the denominator (gross, operating, ordinary, net profit margin, cost of sales ratio, SG&A ratio). Return on Equity uses total equity; Return on Total Capital uses total capital (total assets). Total interest-bearing debt is simply the sum of short-term borrowings, current portion of long-term debt, bonds redeemable within one year, bonds and convertible bonds, and long-term borrowings.
$$\text{ROE} = \frac{\text{Net Income}}{\text{Total Equity}} \times 100\%$$ $$\text{Return on Total Capital} = \frac{\text{Ordinary Income}}{\text{Total Capital}} \times 100\%$$ $$\text{Gross Profit Margin} = \frac{\text{Gross Profit}}{\text{Revenue}} \times 100\%$$ $$\text{Operating Margin} = \frac{\text{Operating Income}}{\text{Revenue}} \times 100\%$$ $$\text{Ordinary Margin} = \frac{\text{Ordinary Income}}{\text{Revenue}} \times 100\%$$ $$\text{Net Margin} = \frac{\text{Net Income}}{\text{Revenue}} \times 100\%$$ $$\text{Cost of Sales Ratio} = \frac{\text{Cost of Goods Sold}}{\text{Revenue}} \times 100\%$$ $$\text{SG\&A Ratio} = \frac{\text{SG\&A Expenses}}{\text{Revenue}} \times 100\%$$ $$\text{Total Interest-Bearing Debt} = \text{Short-term Borrowings} + \text{Current Portion LT Debt} + \text{Bonds Due Within 1yr} + \text{Bonds and Convertibles} + \text{Long-term Borrowings}$$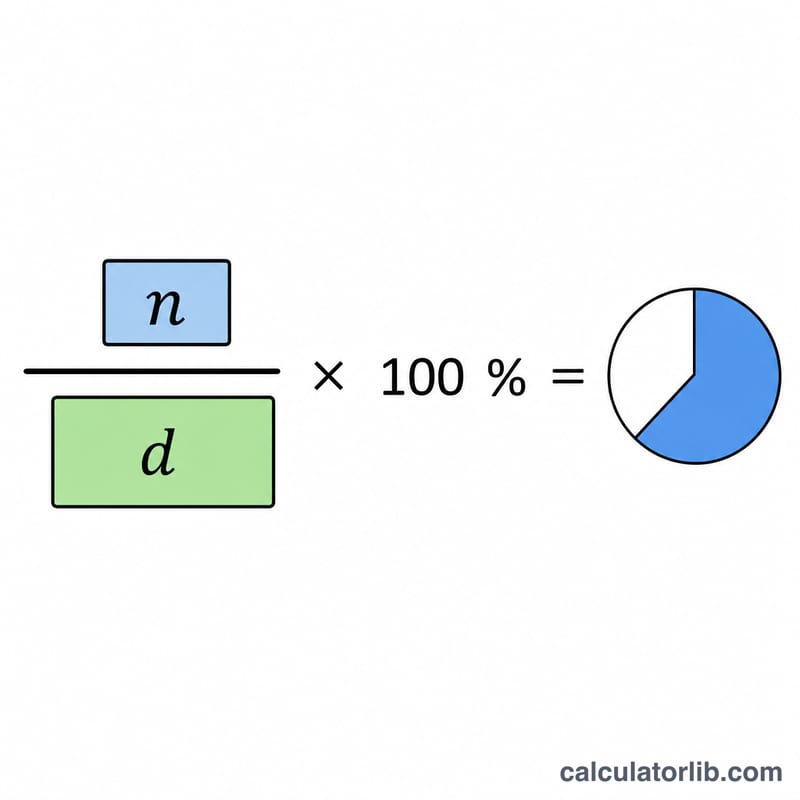
Worked example
With revenue 1,000,000, COGS 600,000, gross profit 400,000, operating income 150,000, ordinary income 140,000, net income 90,000, total equity 500,000 and total capital 800,000:
$$\text{ROE} = \frac{90{,}000}{500{,}000} \times 100 = 18.00\%$$ $$\text{Return on Total Capital} = \frac{140{,}000}{800{,}000} \times 100 = 17.50\%$$gross margin 40.00%, operating margin 15.00%, net margin 9.00%, and cost of sales ratio 60.00%.
FAQ
Why are some results "N/A"? If revenue is zero the margin ratios are undefined; if total equity or total capital is zero, ROE or Return on Total Capital is undefined.
Can ratios be negative? Yes. A loss-making company produces negative margins and a negative ROE, which is correct and not clamped.
Is the cost of sales ratio "good" when high? No, it is inverted: a lower cost of sales ratio is better, since it means more of each sales dollar remains as gross profit.