What It Is
The Profitability Ratios Calculator turns raw figures from a company's income statement and balance sheet into the standard set of profitability metrics used by investors, analysts and managers worldwide. It computes Return on Assets (ROA), Return on Equity (ROE), gross, operating and net profit margins, Earnings per Share (EPS) and the Price/Earnings (P/E) ratio. You can fill in Column A for one company or period and Column B for a second, allowing instant side-by-side comparison.
How to Use It
Enter the monetary figures (in any single currency) and share counts for Column A. The defaults show a worked example. To compare, fill Column B with a second set of figures; ratios appear automatically for whichever column has the inputs needed. Each ratio is computed only when its denominator is non-zero, so partial data still produces every metric it can. The Significant Figures dropdown changes display rounding only and never affects the math.
The Formulas Explained
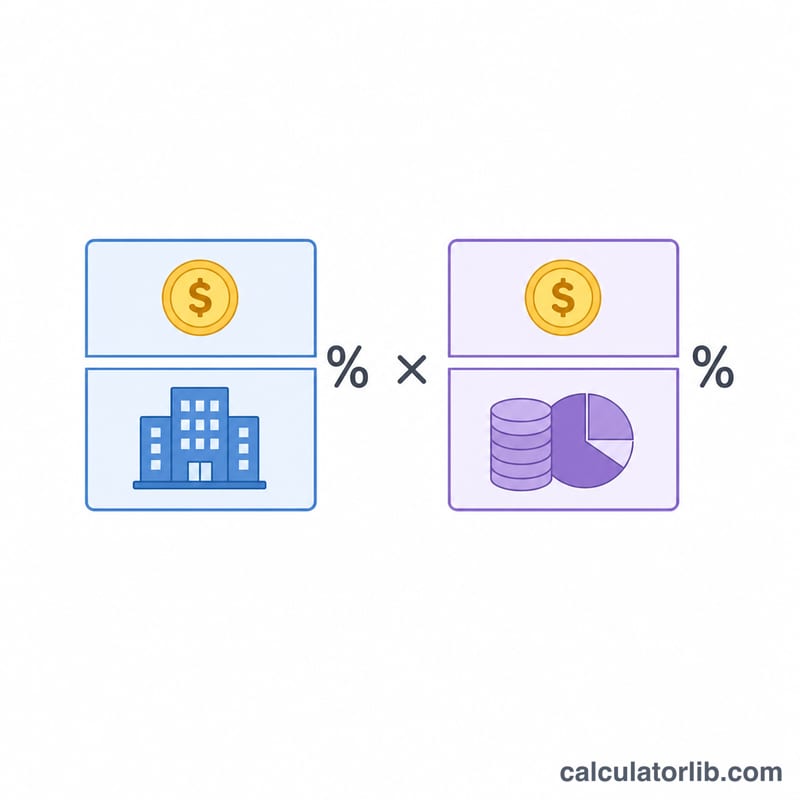
$$\text{ROA} = \frac{\text{Net Income}}{\text{Total Assets}} \times 100$$ measures how efficiently assets generate profit. $$\text{ROE} = \frac{\text{Net Income}}{\text{Shareholder Equity}} \times 100$$ shows the return earned on owners' capital. The three margins divide gross profit, operating profit (EBIT) and net income by sales, each times 100. $$\text{EPS} = \frac{\text{Net Income}}{\text{Common Shares Outstanding}}$$ states profit attributable to each share. $$\text{P/E} = \frac{\text{Market Price per Share}}{\text{EPS}}$$ indicates how much the market pays per unit of earnings. Negative inputs (a net loss) produce valid negative ratios.
Worked Example
With net income 100,000, total assets 1,000,000, equity 400,000, gross profit 300,000, sales 900,000, operating profit 180,000, 50,000 shares and a price of 30: $$\text{ROA} = \frac{100{,}000}{1{,}000{,}000} \times 100 = 10\%$$ $$\text{ROE} = \frac{100{,}000}{400{,}000} \times 100 = 25\%$$ $$\text{gross margin} = \frac{300{,}000}{900{,}000} \times 100 = 33.3\%$$ $$\text{operating margin} = \frac{180{,}000}{900{,}000} \times 100 = 20\%$$ $$\text{net margin} = \frac{100{,}000}{900{,}000} \times 100 = 11.1\%$$ $$\text{EPS} = \frac{100{,}000}{50{,}000} = 2.00$$ and $$\text{P/E} = \frac{30}{2.00} = 15.0.$$
FAQ
Why does a ratio show N/A? Its denominator is zero or blank (for example, ROA needs total assets and EPS needs shares outstanding), so the result would be undefined.
Can I use any currency? Yes. All monetary inputs must simply be in the same currency; the formulas are unit-agnostic and apply identically everywhere.
Are margins shown as percentages? Yes. ROA, ROE and all margins are multiplied by 100, while EPS (currency per share) and P/E (a pure ratio) are left as raw numbers.