What is the logistic growth model?
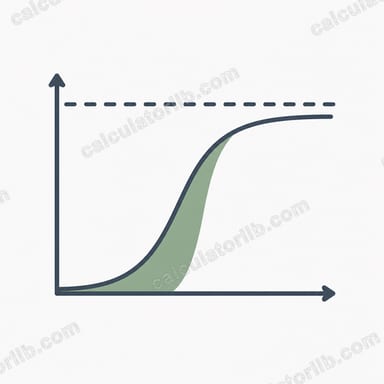
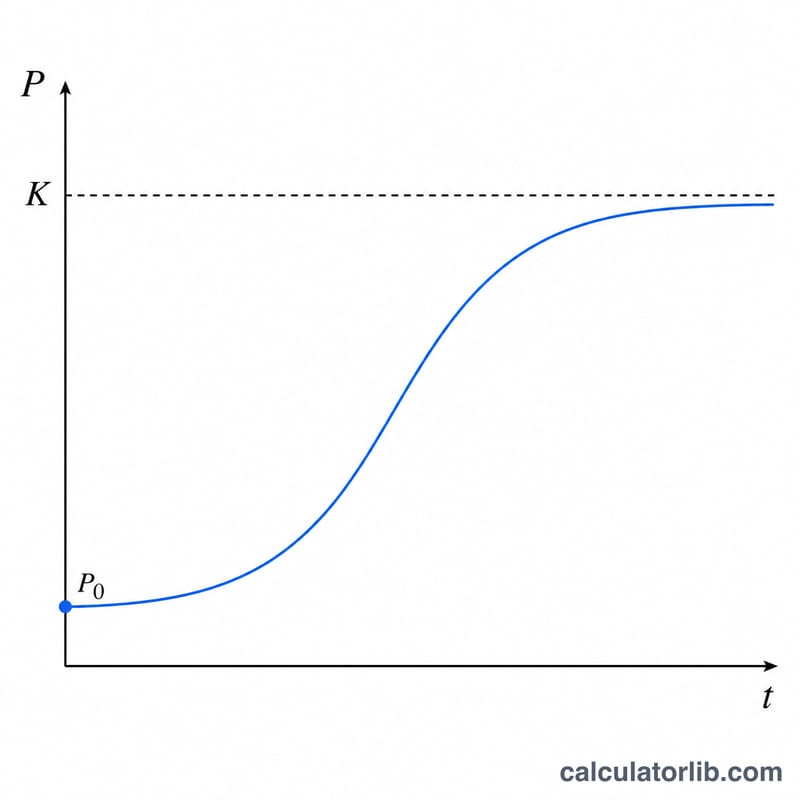
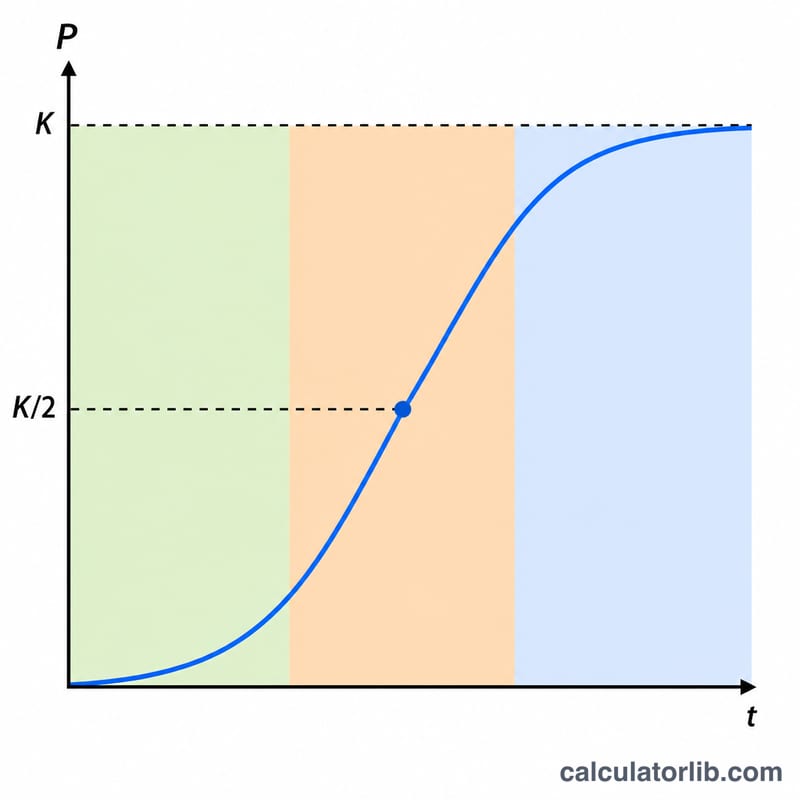
The logistic growth model describes how a population grows quickly when it is small and then slows as it approaches a maximum sustainable size called the carrying capacity (K). Unlike unlimited exponential growth, the logistic curve is S-shaped (sigmoid): rapid early growth, an inflection point at K/2, and a plateau near K. It is widely used in ecology, biology, epidemiology, and even technology adoption and market saturation models.
How to use this calculator
Enter four values: the carrying capacity K (the upper limit), the initial population P0 at time zero, the intrinsic growth rate r (per unit time), and the elapsed time t. The calculator returns the population P(t), the model constant A, and the total growth since the start.
The formula explained
The model is $$P(t) = \frac{\text{K}}{1 + A\,e^{-\text{r}\cdot\text{t}}}$$ where \(A = \frac{\text{K} - \text{P}_0}{\text{P}_0}\). The constant \(A\) is fixed by the starting conditions so that \(P(0) = P_0\). As \(t\) increases, the term \(e^{-rt}\) shrinks toward zero, the denominator approaches 1, and \(P(t)\) approaches \(K\). The growth rate \(r\) controls how steep the climb is.
Worked example
Suppose \(K = 1000\), \(P_0 = 10\), \(r = 0.5\), and \(t = 5\). First $$A = \frac{1000 - 10}{10} = 99.$$ Then $$e^{-0.5\cdot 5} = e^{-2.5} \approx 0.082085.$$ The denominator $$= 1 + 99\cdot 0.082085 \approx 9.1264,$$ so $$P(5) = \frac{1000}{9.1264} \approx 109.57.$$ The population grew from 10 to about 110 in 5 time units.
FAQ
What happens if r is negative? A negative r models decline toward zero rather than growth toward K.
What is the inflection point? The growth is fastest when P = K/2; before that the curve accelerates, after it the curve decelerates.
Can P exceed K? If the initial population starts above K (overshoot), the model returns values that decay down toward K over time.


