What this calculator does
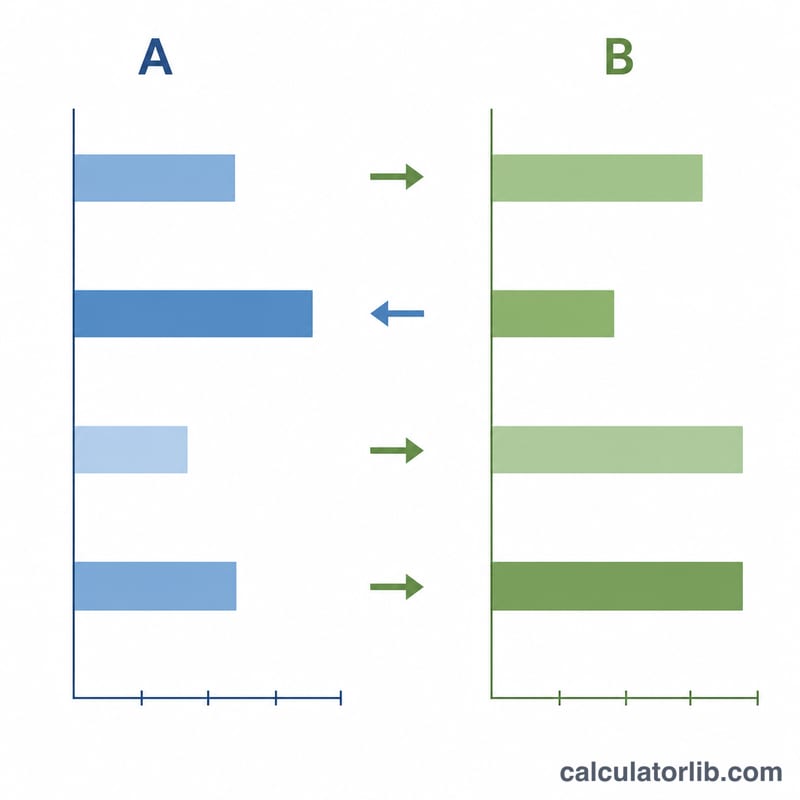
The Operations Ratios Calculator computes the core activity (efficiency) ratios used to judge how well a business uses its assets: Inventory Turnover, Total Asset Turnover, Average Collection Period, and the Equity Multiplier. It is universal accounting math, so it works with any currency — just enter your figures in the units you already use. You can also enter a second scenario (column B) to see the change between two periods, budgets, or what-if cases.
How to use it
Enter your figures for scenario A (Cost of Goods Sold, Inventory, Sales, Total Assets, Accounts Receivable, Sales for the Reporting Period, and Shareholder Equity). Optionally fill in scenario B to enable a side-by-side comparison and a Change column (B minus A). Set the Reporting Period in days (commonly 365) and choose how many significant figures to display. Any ratio whose denominator is zero is shown as undefined ("—") rather than infinity.
The formulas
Inventory Turnover = COGS / Inventory. Total Asset Turnover = Sales / Total Assets. Average Collection Period = (Accounts Receivable / Period Sales) x Days, which equals receivables divided by average daily sales. Equity Multiplier = Total Assets / Shareholder Equity, a measure of financial leverage.
$$\text{Inventory Turnover} = \dfrac{\text{COGS}}{\text{Inventory}}$$$$\text{Total Asset Turnover} = \dfrac{\text{Sales}}{\text{Total Assets}}$$$$\text{ACP} = \dfrac{\text{Accounts Receivable}}{\text{Period Sales}} \times \text{Days}$$$$\text{Equity Multiplier} = \dfrac{\text{Total Assets}}{\text{Shareholder Equity}}$$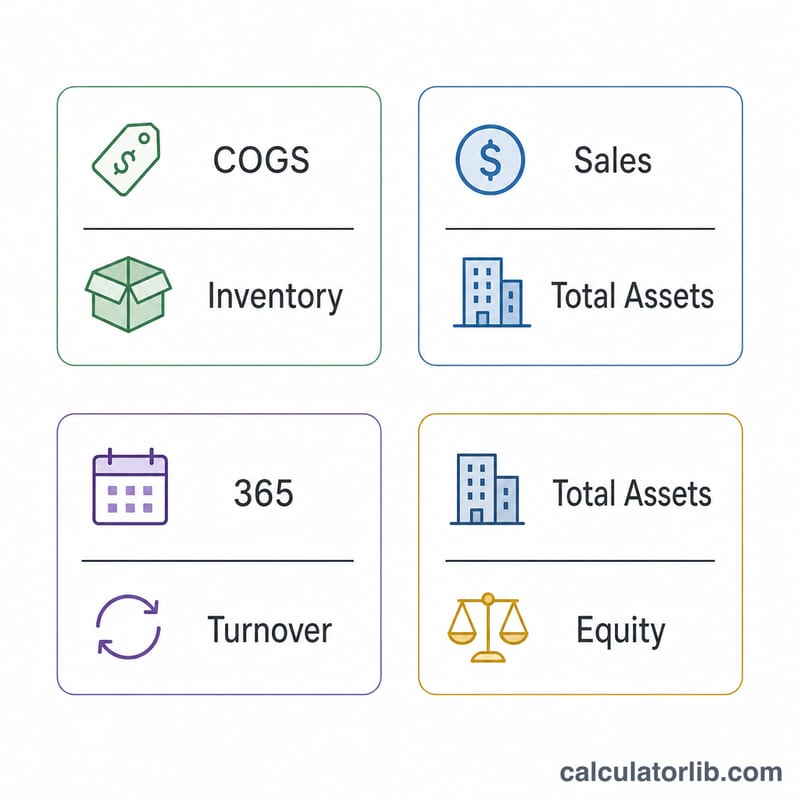
Worked example
With COGS = 100,000, Inventory = 17,000, Sales = 90,000, Total Assets = 250,000, Accounts Receivable = 8,000, Period Sales = 90,000, Shareholder Equity = 120,000 and 365 days at 3 significant figures:
$$\text{Inventory Turnover} = \dfrac{100{,}000}{17{,}000} = 5.88$$$$\text{Total Asset Turnover} = \dfrac{90{,}000}{250{,}000} = 0.360$$$$\text{Average Collection Period} = \dfrac{8{,}000}{90{,}000} \times 365 = 32.4 \text{ days}$$$$\text{Equity Multiplier} = \dfrac{250{,}000}{120{,}000} = 2.08$$If scenario B raises Total Assets to 300,000 (equity unchanged), its Equity Multiplier is \(2.50\), a Change of \(+0.42\).
FAQ
Why is a ratio shown as a dash? The denominator was zero, so the ratio is mathematically undefined; fill in that figure to compute it.
What does "significant figures" do? It controls display precision only; the underlying math is unrounded. "auto" shows natural precision.
Should I use net or gross sales? Use net sales (revenue) consistently for turnover, and credit/net sales for the collection period to keep the comparison meaningful.